
After reviewing data from a couple of significantly different cars that were both equipped with the SRM v2 intercoolers I am updating the IC data scatter plot. Bear in mind that the temperature data is subject to some error due to the way temperature rise over a FATS is recorded. The chart should still provide a rough relative landscape of the various IC options.
[notice]Note: On the chart below the Apikols and SRM v1 IC’s are shown plotted on the Y-axis, or zero temperature rise, because I do not have any qualifying IAT rise data to use. I only have flow data for those two items.[/notice]
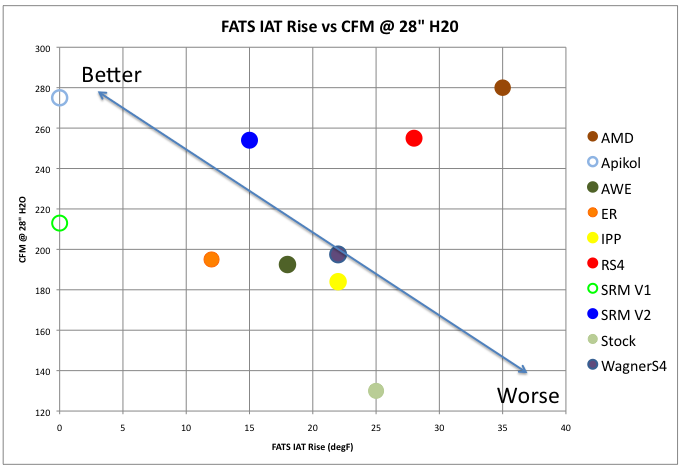 [warning]To emphasize if it is not clear from the description above, the Temperature Rise data is approximate. Use this chart as a guide, not the definitive word on how these Intercoolers compare.[/warning]