The data presented in the charts below was collected to answer questions about the susceptibility of the ER intercoolers to heatsinking and recovery time once heated. One concern raised about the ER intercoolers has been that once they heat up it could take a long time for them to cool off.
Two scenarios were used to collect the data, in the first the car was driven in stop and go traffic for several minutes and then operated at steady state highway speeds. There were ten data points collected for each brand of intercooler. The second scenario was FATS pulls, which entails a short maximum acceleration run. There were seven data points for the AWE intercoolers and nine datapoints for the ER intercoolers.
The Results
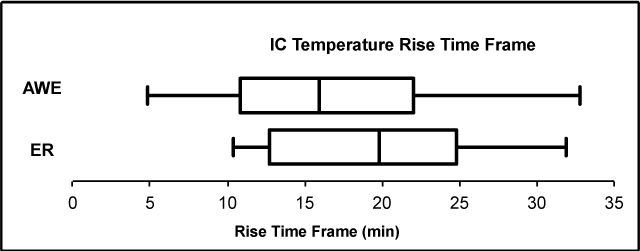
The first chart, IC Temperature Rise Time Frame, shows for how many minutes the car was in stop and go traffic prior to transitioning to steady state highway driving.
The next chart, IC Temperature Rise, shows by how much the intake air temperatures with each intercooler rose during the stop and go driving period.

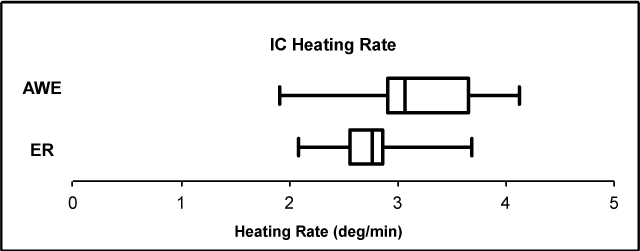
The chart below, IC Heating Rate, shows how rapidly the intake air temperature rose for each intercooler expressed as a ratio of temperature rise over rise timeframe. The take away from this chart is that the ER intercoolers heat up the intake air more slowly in stop and go traffic than do the AWE IC’s.
 At the conclusion of the heating period the IC’s were exposed to highway speed steady state driving for several minutes to observe the cool down characteristics.
In the first cool down chart, IC Temperature Drop Time Frame, the duration of the steady state drive period is shown.
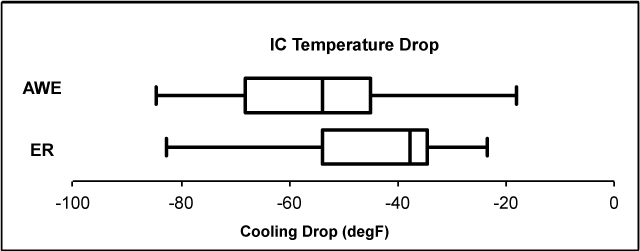
 The next chart, IC Temperature Drop, shows how much drop was recorded for the intake air temperature during the time period of steady state driving.
 The next chart, IC Cooling Rate, illustrates the speed at which the respective intercoolers cooled the intake air temperature, this is sometimes referred to as recovery. It should be pointed out that the extent of heating experienced by the intercooler will factor into the cooling rate. For example, if intercooler (A) undergoes a 100F temperature rise during a 10 minute heating period, and IC (B) heats up 50F, IC (B) would be deemed better performing if they each started at the same temperature. If during a 10 minute cooling period both IC’s returned the intake air to a temperature of 50F, that is, (A) drops from 150F to 50F and (B) drops from 100F to 50F, the cooling rate of IC (A) would be greater than IC (B), yet IC (A) would likely not be the preferred intercooler.
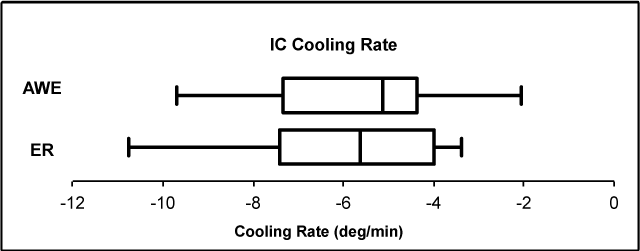 The next chart, IC Cooling / Heating Ratio, attempts to give a better picture of relative heating and cooling performance and overall intercooler resistance to heatsoak and recovery time. A greater ratio indicates the intercooler is better at cooling intake charge and more resistant to heatsoak for the test conditions.

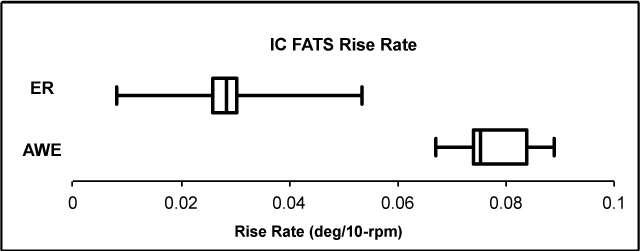
The next charts show results obtained during a series of FATS pulls.
The first chart, IC FATS Rise Rate, shows how rapidly the intake air temperature rose, as measured by rpm increase, over a FATS pull.
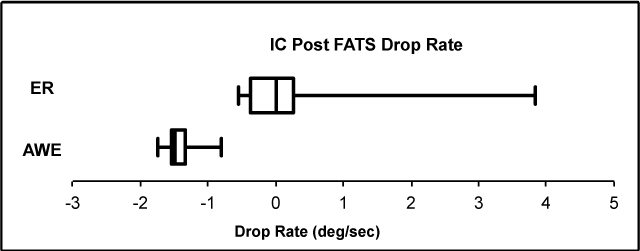
 The final chart, IC Post FATS Drop Rate, shows the rate at which the intake air temperature dropped following the conclusion of the FATS pull. Once again it is important to consider the extent of temperature rise experienced during the pull since a greater temperature rise while under boost could possibly result in a greater temperature drop after the boost event ends.
 Conclusion:
The data that I recorded leads me to believe that concerns about the ER intercoolers suffering from heatsoak or poor recovery time are not warranted, at least not when compared to the alternative AWE intercoolers.