I now have a LOT of data to go through and make sense of. Here are the results from taking my S4 equipped with FrankenTurbo’s F21 mixed flow turbochargers to the Dynojet I have logged my car on previously.

The car was evaluated with three tunes, thanks to Daz for his assistance with getting all three of these together. As in the past timeliness was more critical than thoroughness, I needed to get the car on the dyno and was less concerned with having a smooth tune and more concerned with getting to a point that the car could be dyno’d and logged.
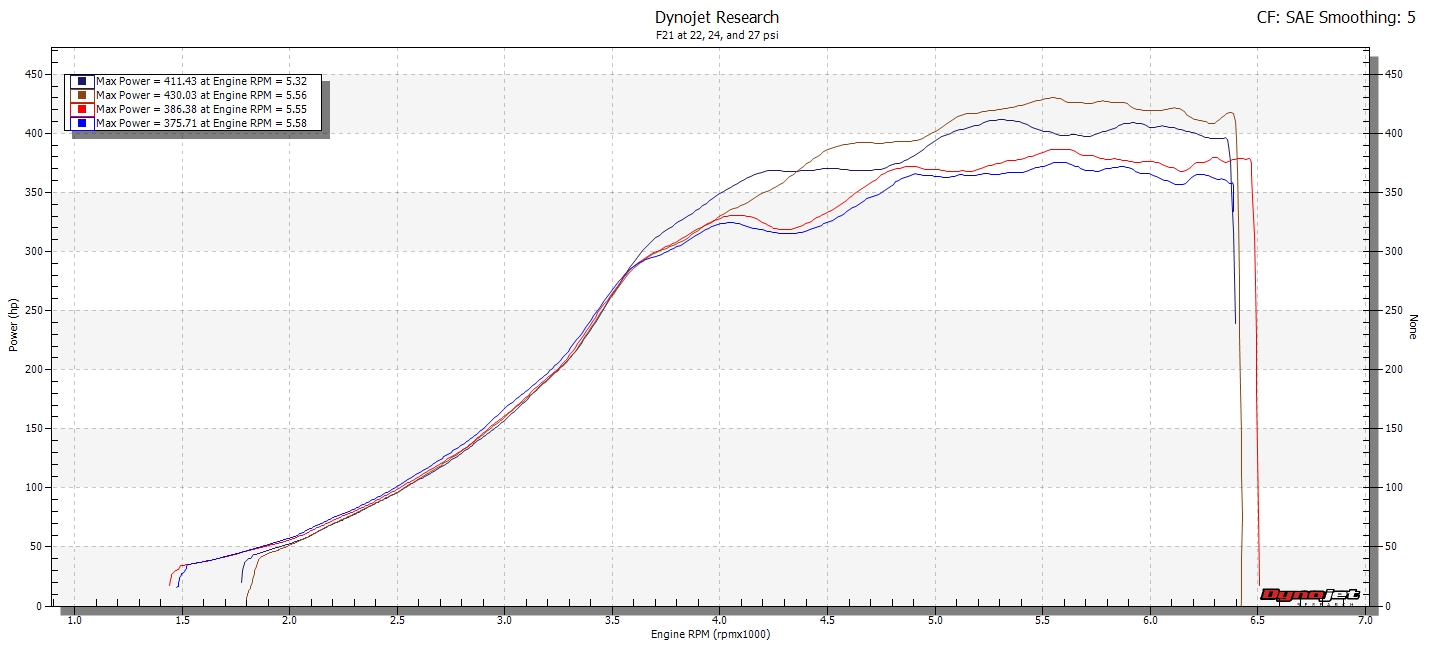
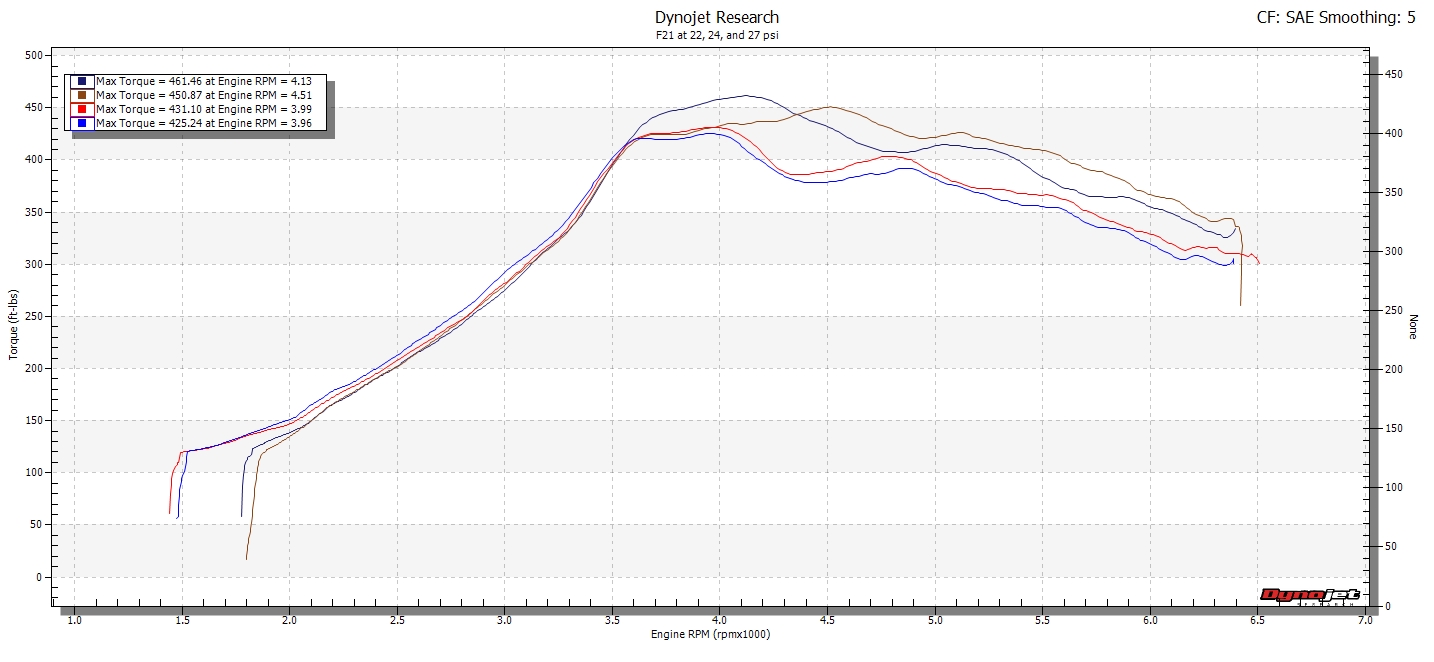
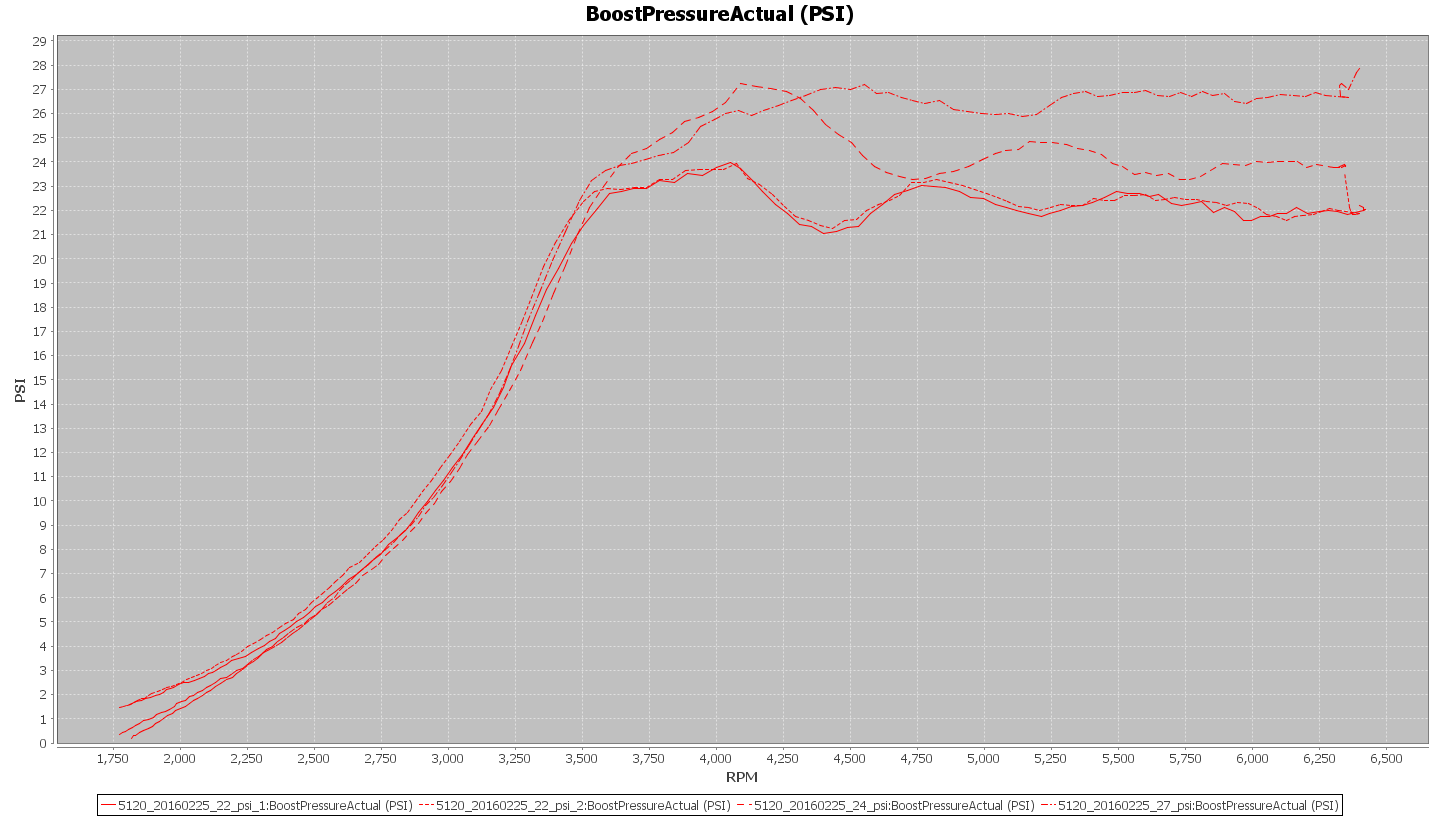
The tunes respectively 1) boost to 27 psi and hold 27 psi, 2) boost to 27 psi and taper to 24 psi, and 3) boost to 23-24 psi and hold approximately 22 psi. The third tune was intended to roughly simulate the boost profile used with the K04 tune I dyno’d previously.
F21 Results
Here are the power and torque results with the F21’s.
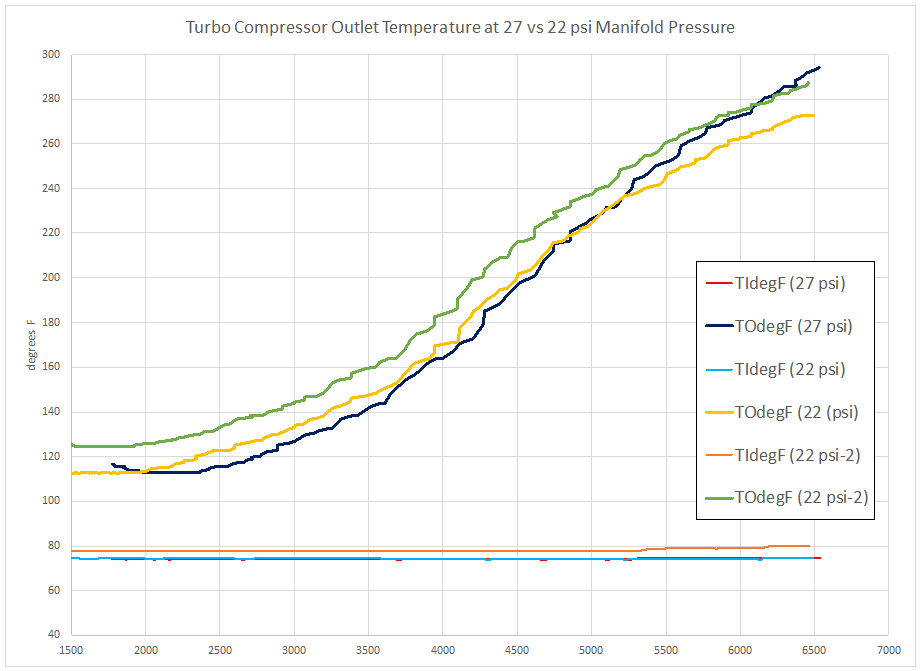
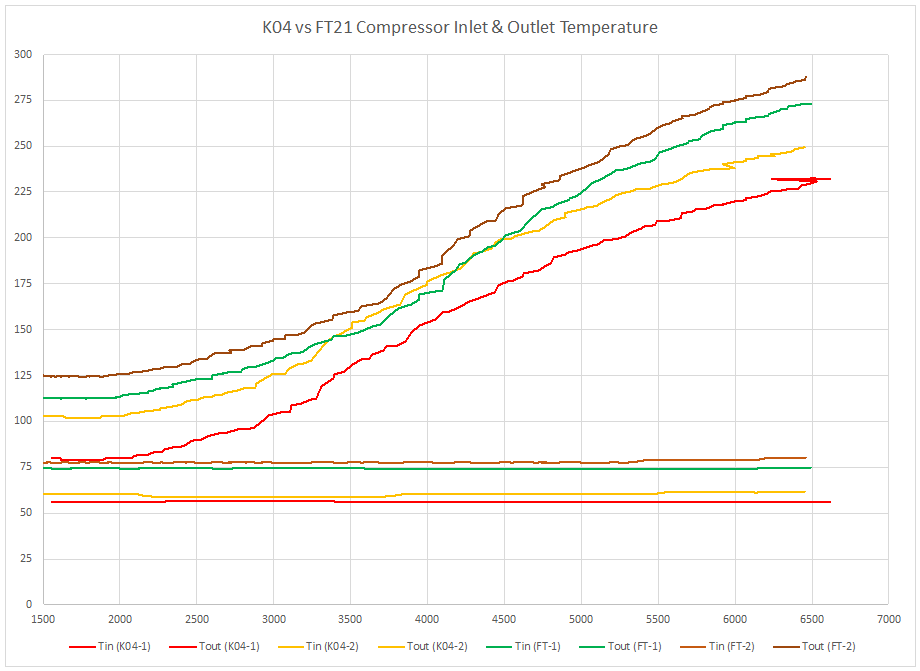
Turbocharger compressor outlet temperatures at 22 and 27 psi:
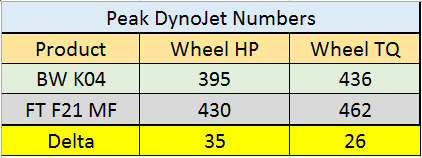
K04 boost comparison
Here are these results compared with those from the BW K04’s.
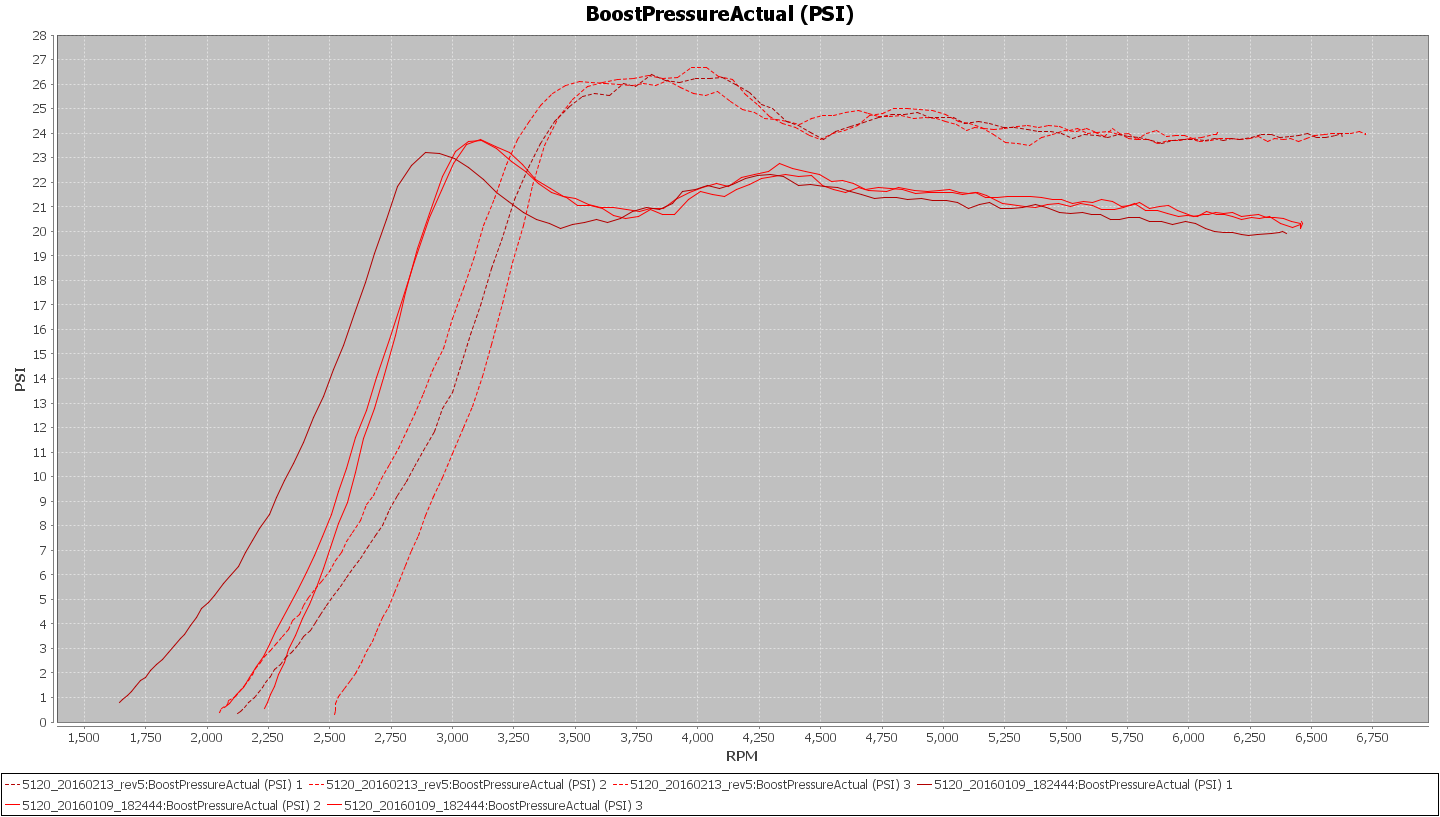
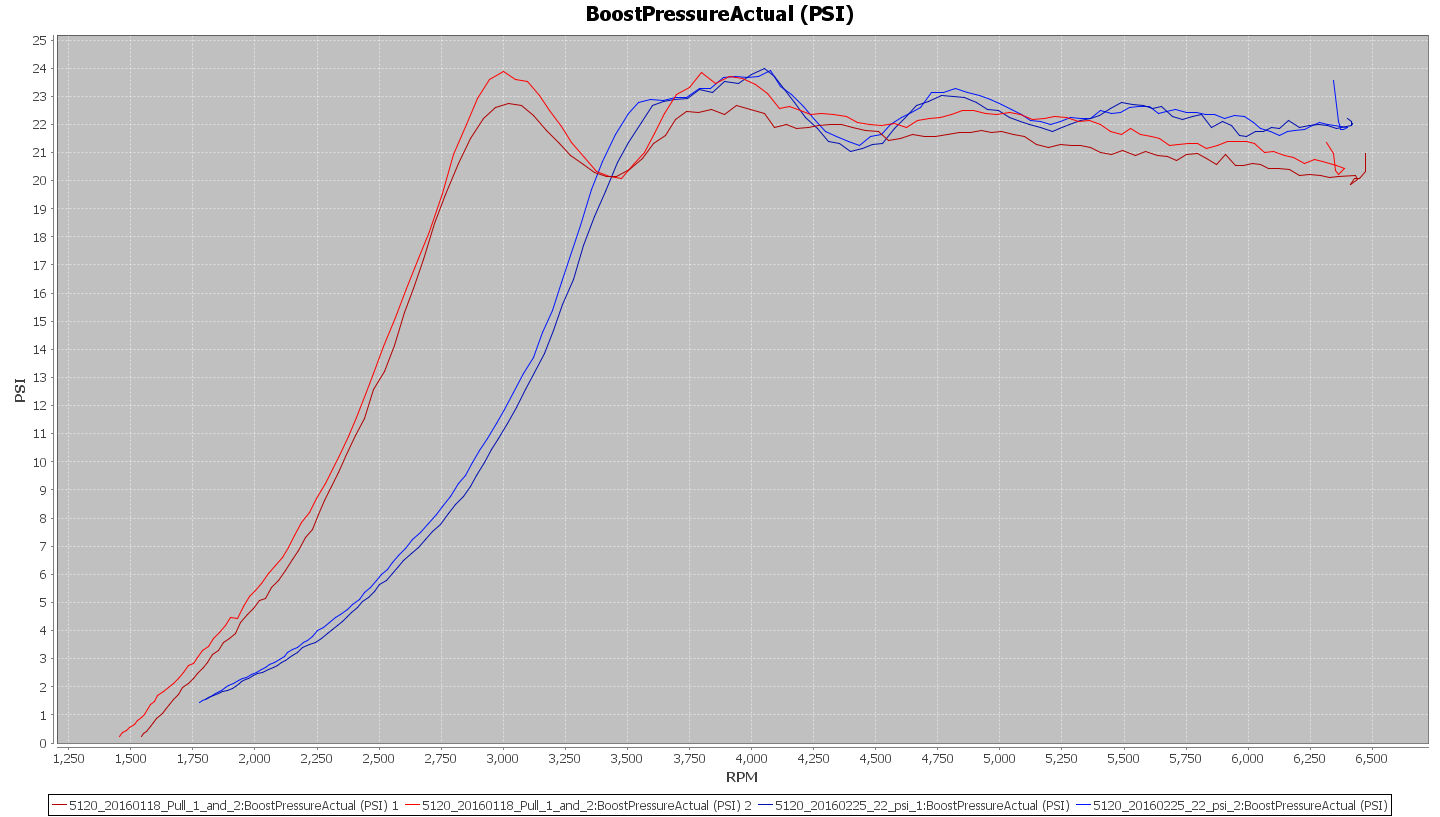
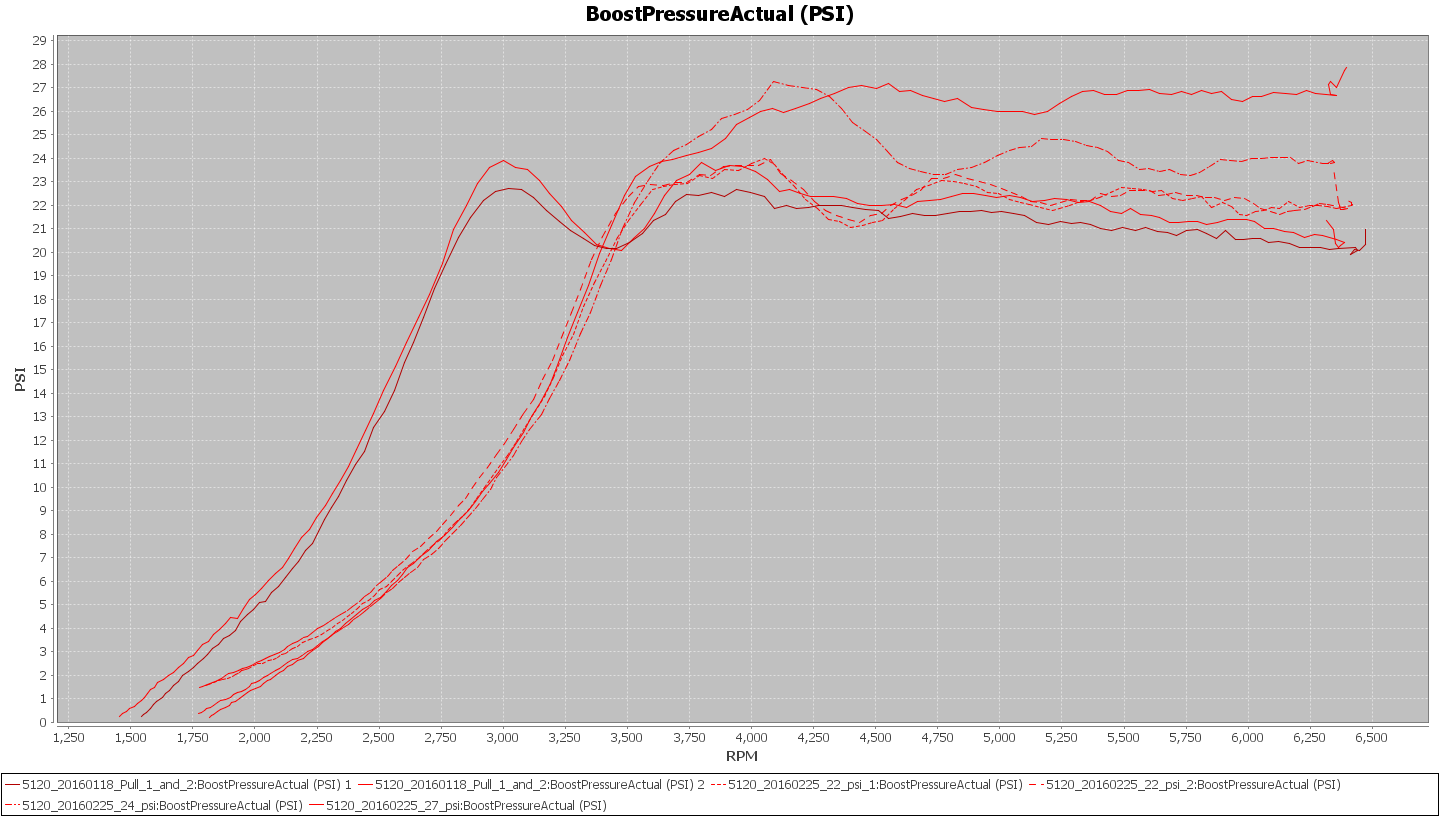
This is how the boost profiles matched up:
And the dyno results:
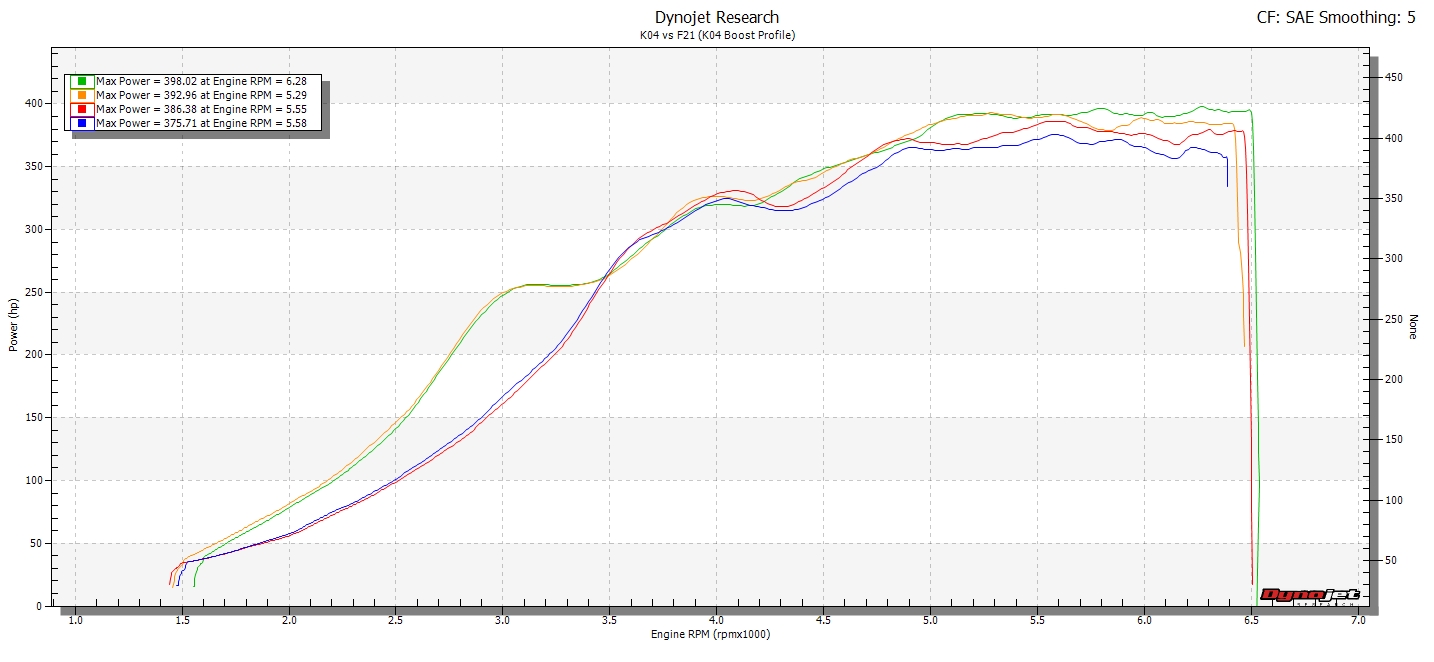
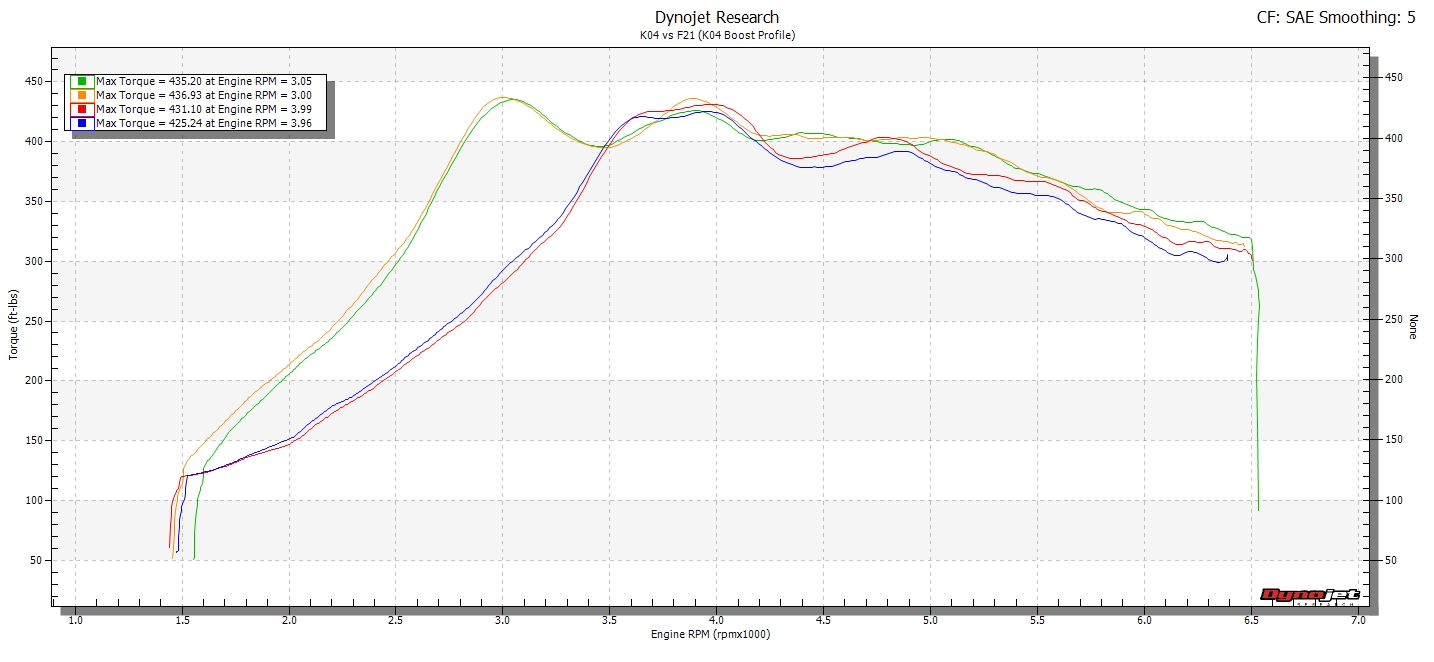
The chart above illustrates the low end strength of the quick spooling BW K04’s.
The point of this comparison at equal boost levels was less about how the dyno numbers would turn out and more about being able to collect temperature and pressure data with similar tunes.
All boost comparison
The following comparison is of the K04’s versus F21’s when operating the F21’s at a boost level more in line with what can better take advantage of the hybrids features.
Here are the boost profiles of K04’s and F21’s:
Dyno results with the F21 low boost pulls removed.
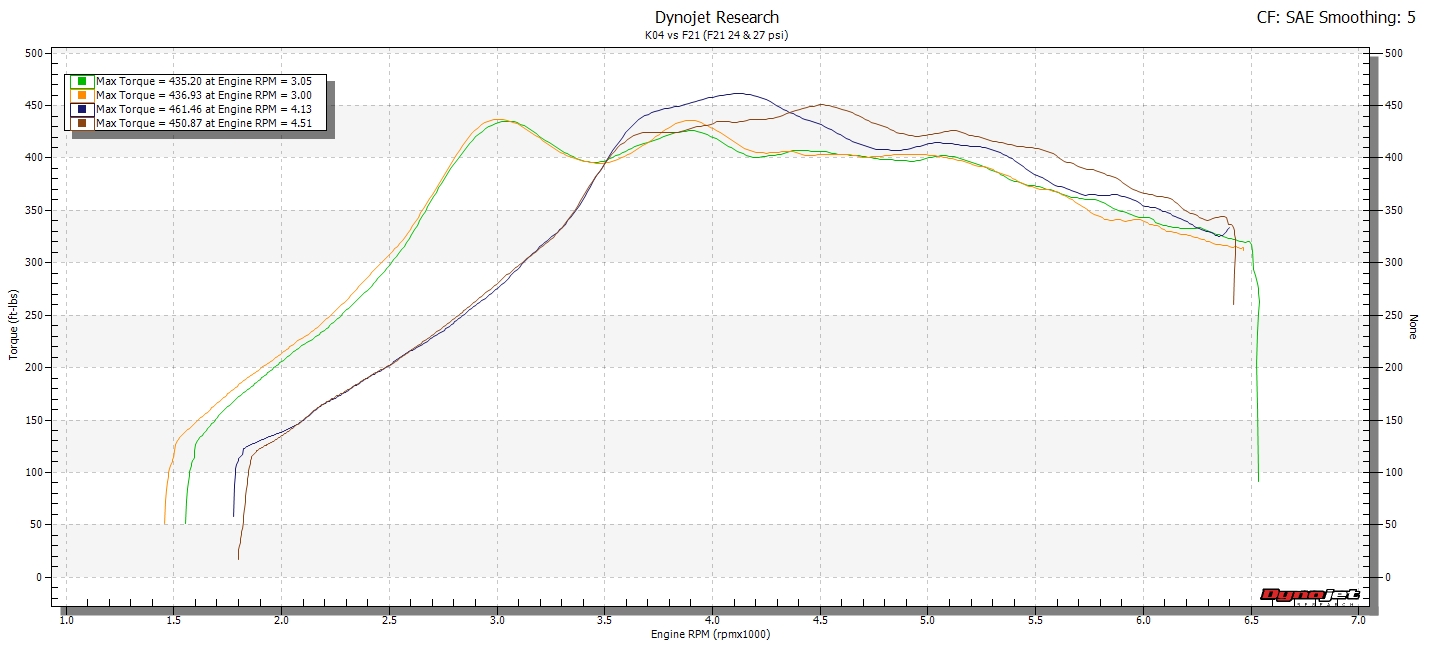
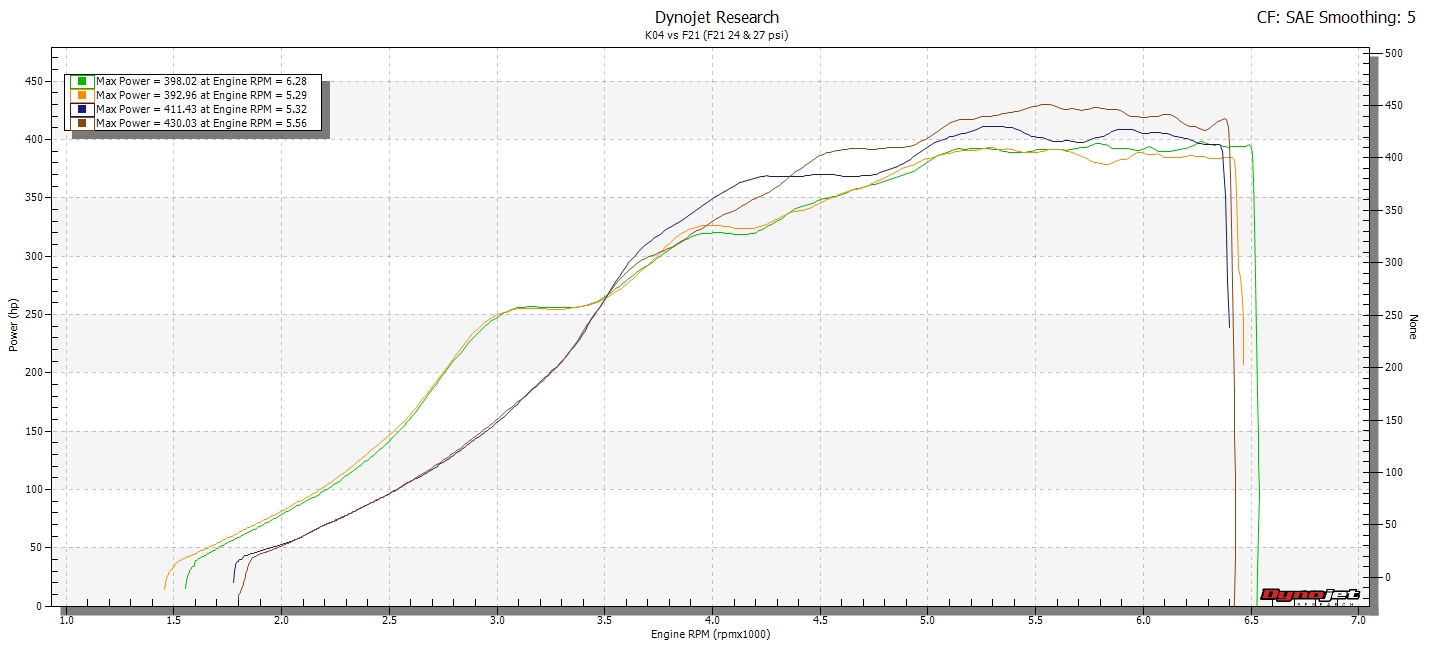
If the F21 tuning had been optimized, based upon the dyno results obtained today, this is how the F21 might compare to the K04.
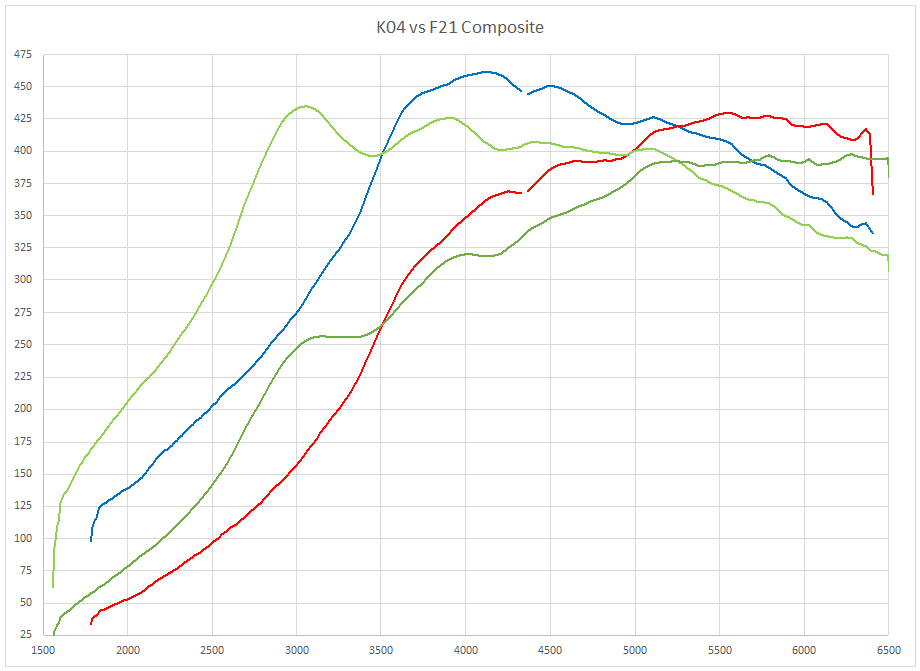
Green lines are for the BW K04’s.
Further comparisons
Much more data was logged on the dyno as well as the street and I will be going through that information to try and draw some conclusions about the attributes of the F21 versus those of the K04.
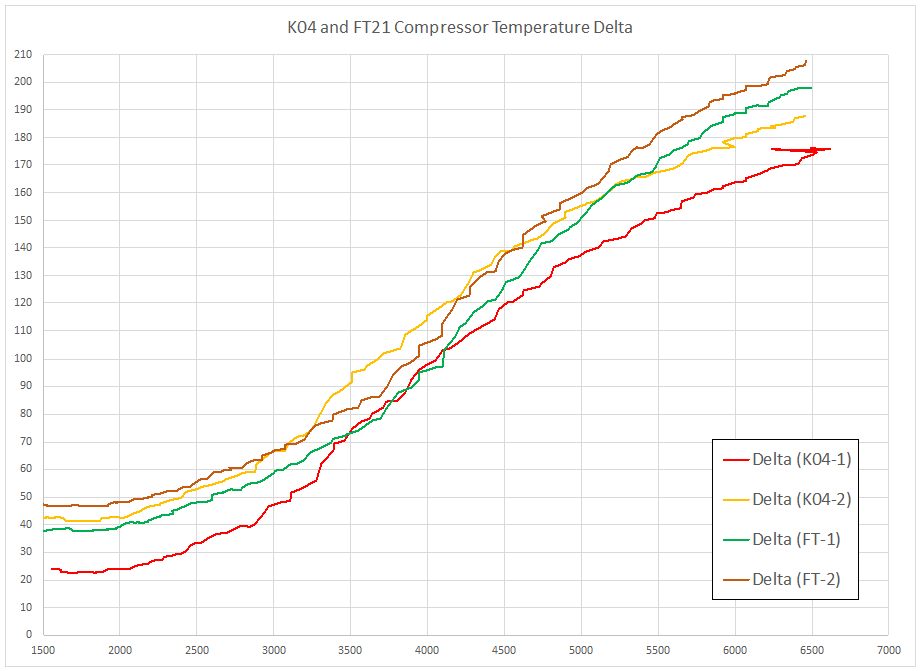
Compressor Temperature Data
Shown as temperature delta:
Comparison of the Intake Air Temperature after being conditioned by the Silly Rabbit Motorsports SMIC’s and TorqByte CM5 Water-Methanol Injection system.
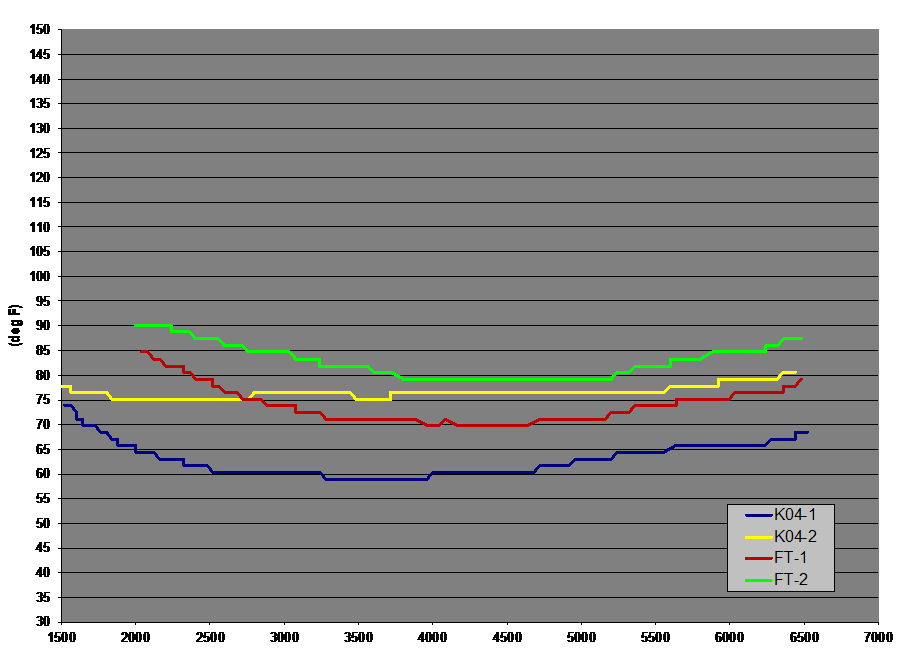
I’m very pleased with these results, especially considering they are occurring on a dyno.
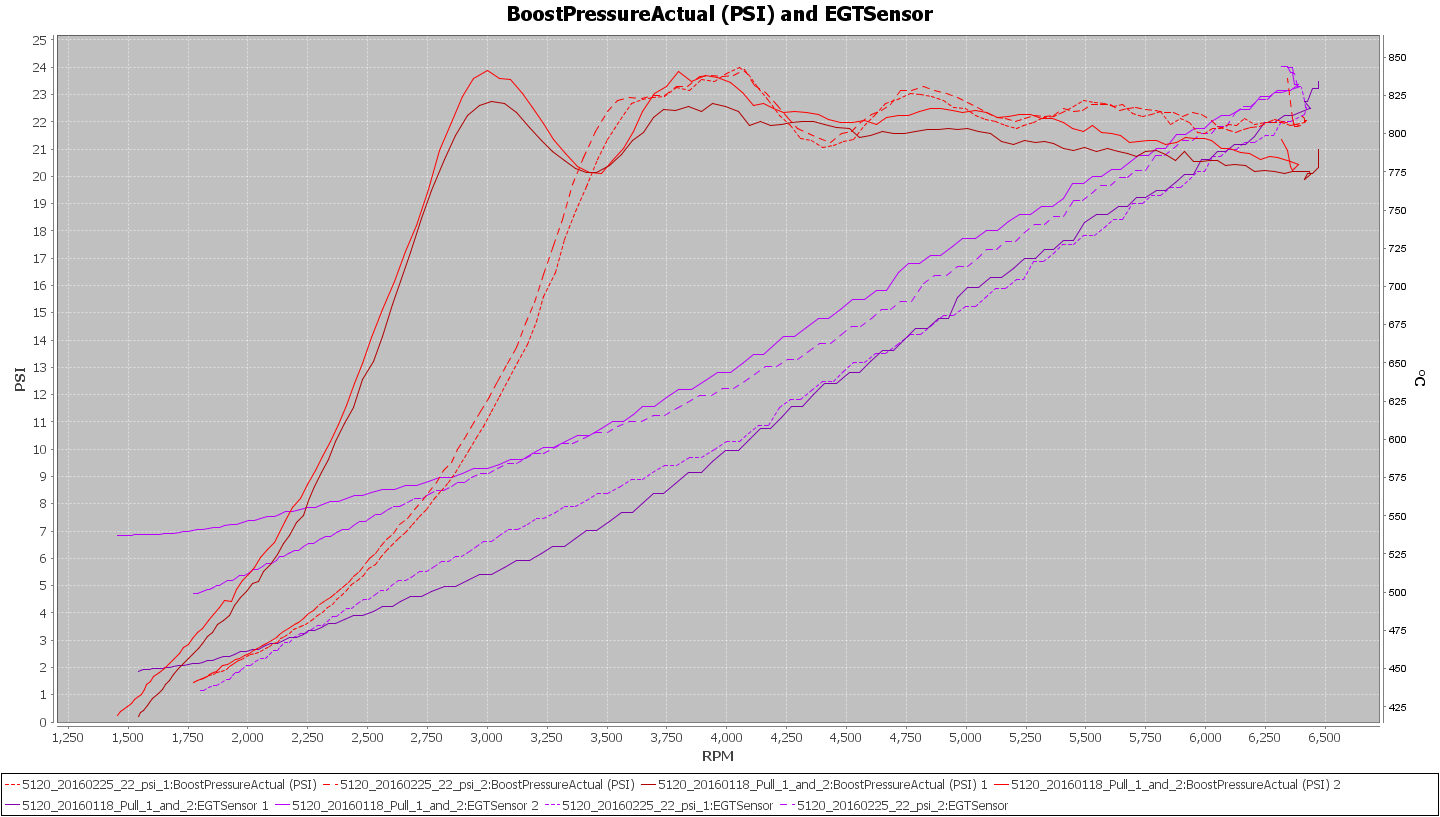
Pre-Turbo Exhaust Gas Temperatures:

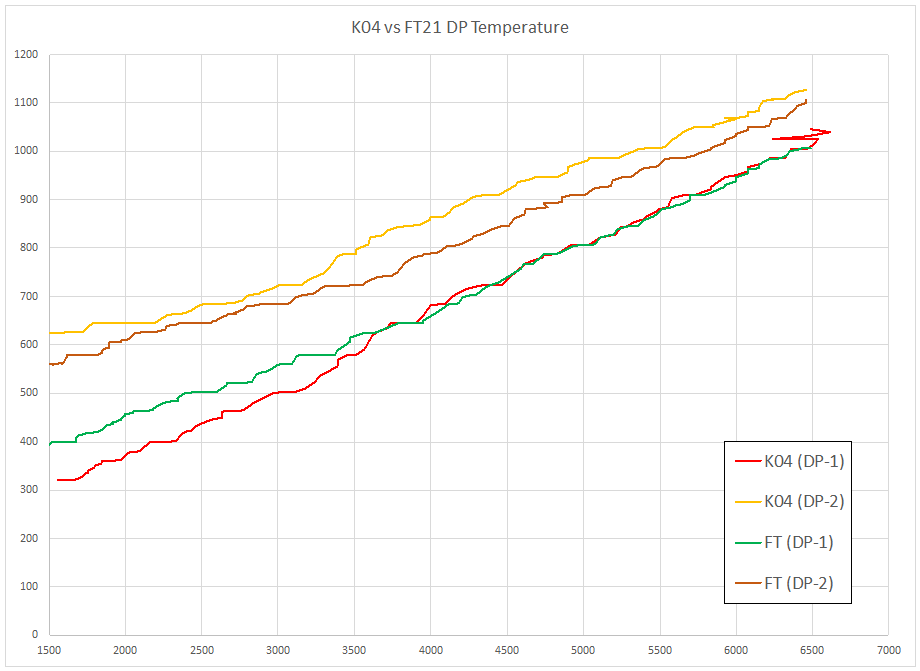
Post-Turbo Exhaust Gas Temperature (degreesF):
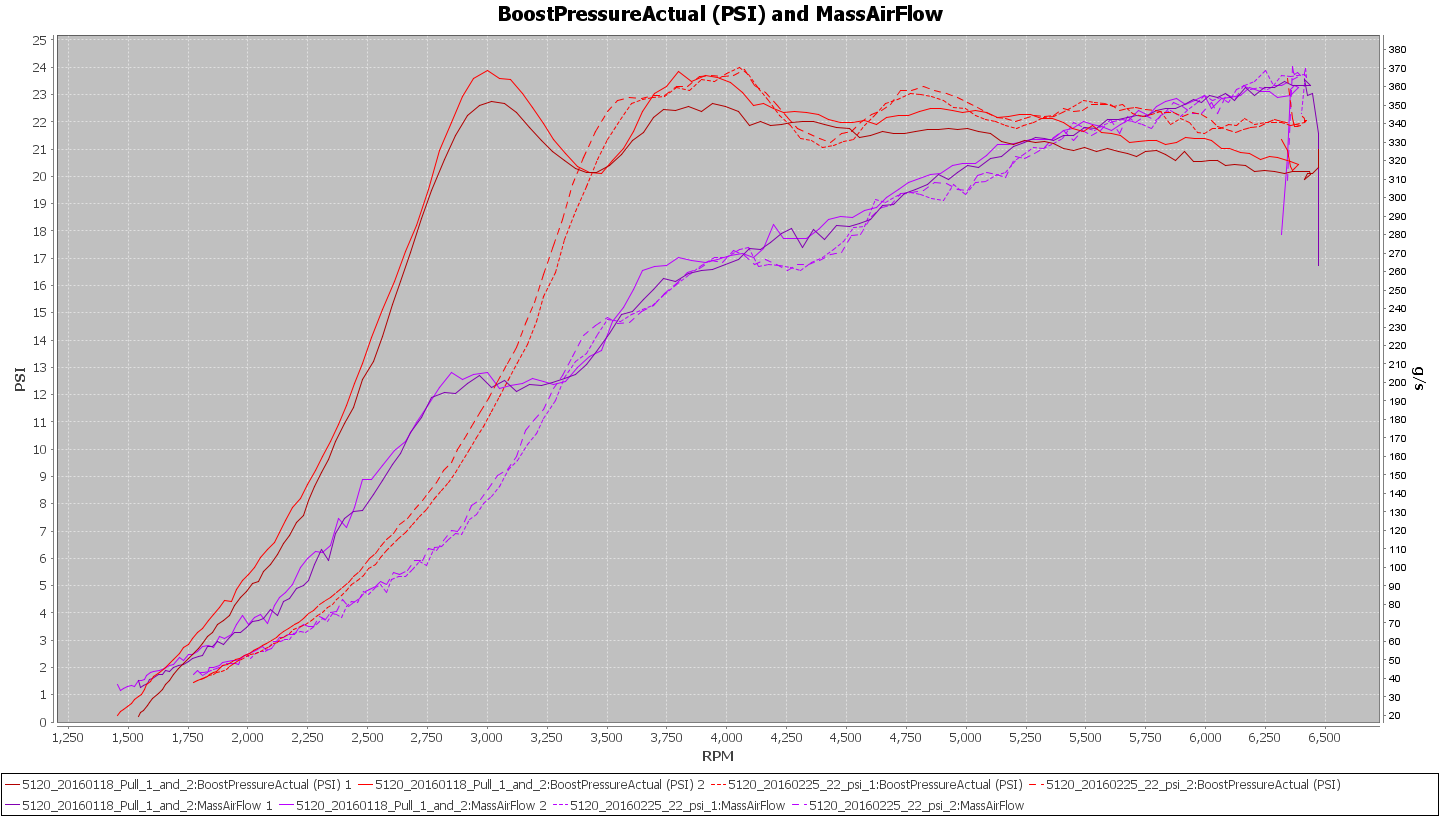
Airflow:
Street Log
Repeating what I said at the top of the post, I have LOT of data to sift through. Weeks of tuning on the K04’s and then F21’s have generated many logs.
Here’s one example of a street log to contemplate how it compares to the dyno logs from above.