SRM on car IC Pressure Drop

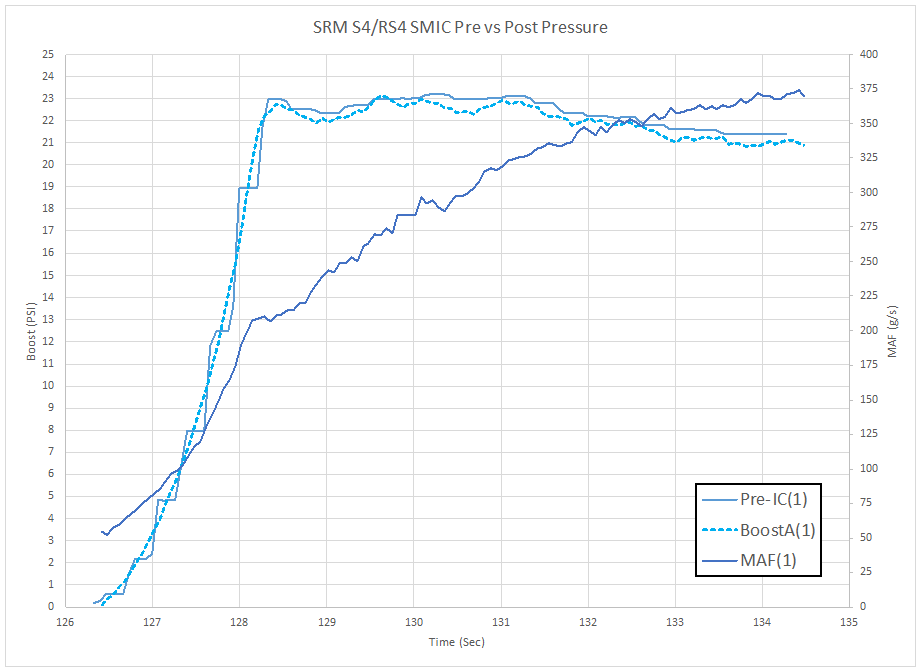
Here’s a chart showing pressure recorded right before the intercooler inlet versus the pressure recorded at the MAP sensor when using BW K04 turbochargers and the SRM Intercoolers.

SRM RS4 SMIC Pressure Differential

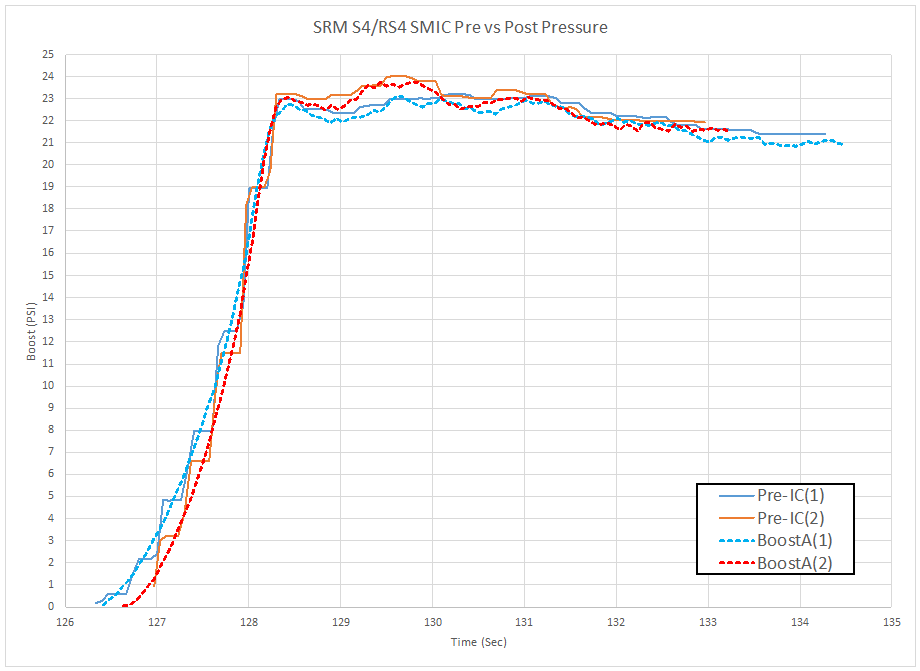
Under normal driving conditions the pre-intercooler sensor reads between 0.05 and 0.1 psi, which leads me to believe there is not much difference between the boost readings attributable to sensor accuracy.

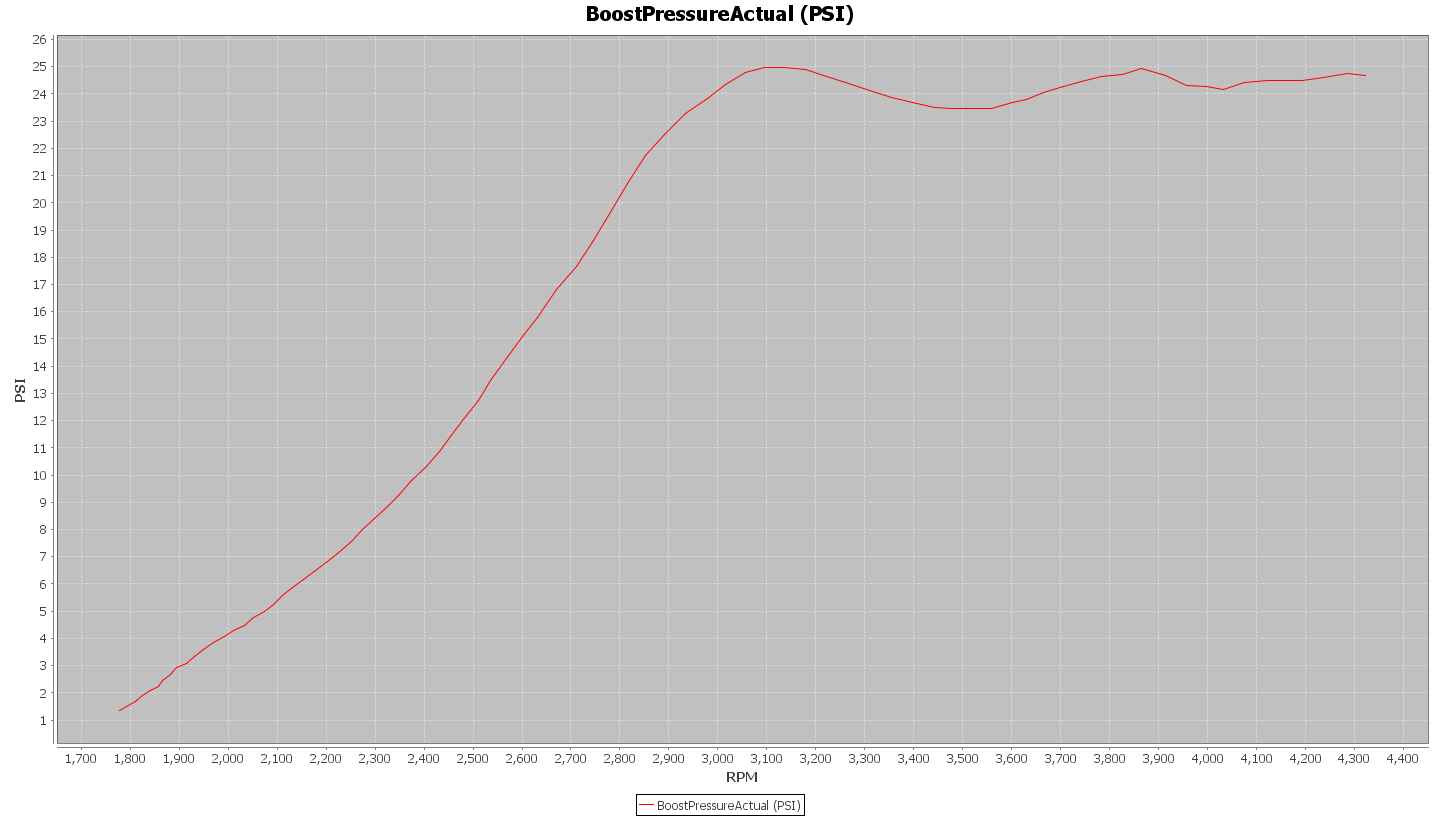
The longer of the two pulls shown is out to approximately 6600 rpm.

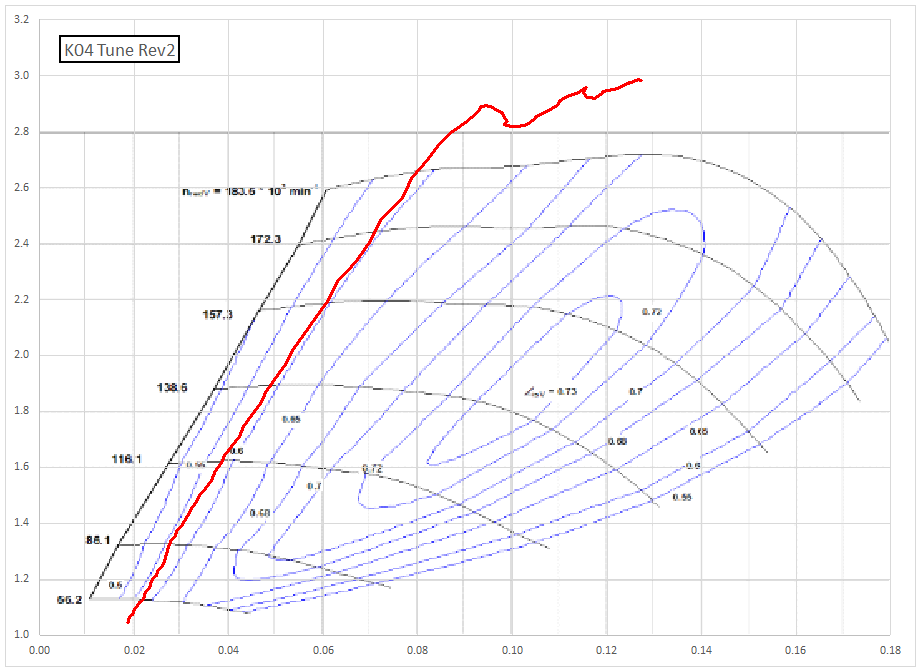
Below is the longer pull with MAF vs Pressure:

SRM RS4/S4 SMIC MAF vs Pressure

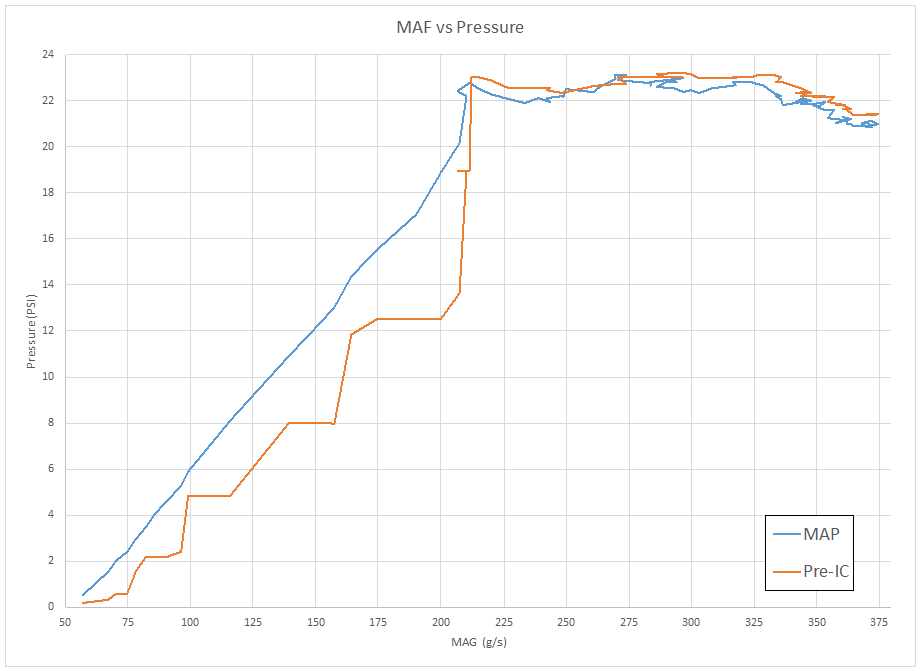
The difference below 200 g/s is probably due to the readings being taken by different data logging equipment.  It is more difficult to match up data points when there isn’t a common reference data as used in the first chart  where pressure from each sensor was plotted versus time.

Boost and MAF on the same chart against Time:

srm_pres_maf2

Need to tune it down

This is an approximation for where the current tune lands on the K04 compressor map.

Plotting the data on the map is subject to errors from estimating the pre-turbocharger pressure losses, post-turbocharger pressure losses, and the engine volumetric efficiency at different speeds.

I’ve previously taken readings of pre and post-turbo pressure losses to have an idea of what they would be, but the readings were not made at this manifold pressure level, which is higher than what the readings were made at.  The higher manifold pressure would result in greater pre and post turbo pressure drop than what I have recorded.  That means the results are potentially further up the compressor map, at a higher PR, than what is shown in the maps below.

For these examples the maximum pre-turbo pressure drop is estimated to be 1 psi and the maximum post-turbo pressure loss is estimated to be 2.5 psi.  The losses increase to the maximum values as a function of engine speed.

Engine VE is estimated as shown here:

Estimate for engine Volumetric Efficiency

Plotting the information produces this result:

Chart of K04 compressor map with high boost tune

Then shown below is a similar boost profile and corresponding map overlay.  This is a shorter pull, but started at a lower rpm, which shifts the boost onset line to the left.  I was concerned about compressor stall possible occurring when going wide open throttle at low engine speed.

Chart of BorgWarner RS4 K04 Boost Onset
BorgWarner RS4 K04 Boost Onset
Chart of K04 compressor map with high boost tune and early wide open throttle
BW RS4 K04

These results are in excess of what I am comfortable with for long term use.

Checking K04 Wastegate Preload

I did a drive today with the N75 valve electronically disconnected in order to check how the boost profile looked when only on wastegate cracking pressure.

The pre-installation check of the wastegate preload showed the wastegates to be set to open around 7.5 psi:

Logging the boost pressure on the road confirmed that the wastegates appear to be functioning correctly at the specified preload reading.

Chart of BorgWarner RS4 K04 boost profile on stock wastegate cracking pressure
BorgWarner RS4 K04 boost profile on stock wastegate cracking pressure