What was done:
As a follow-on to the exhaust manifold pressure drop testing that was performed I decided to use a velocity probe to assess the airflow velocity out of the exhaust manifold at a fixed airflow rate.
Products:
I still had available the AWE Tuning, Silly Rabbit Motorsport, and Audi S4 stock exhaust manifolds.

Test Procedure:
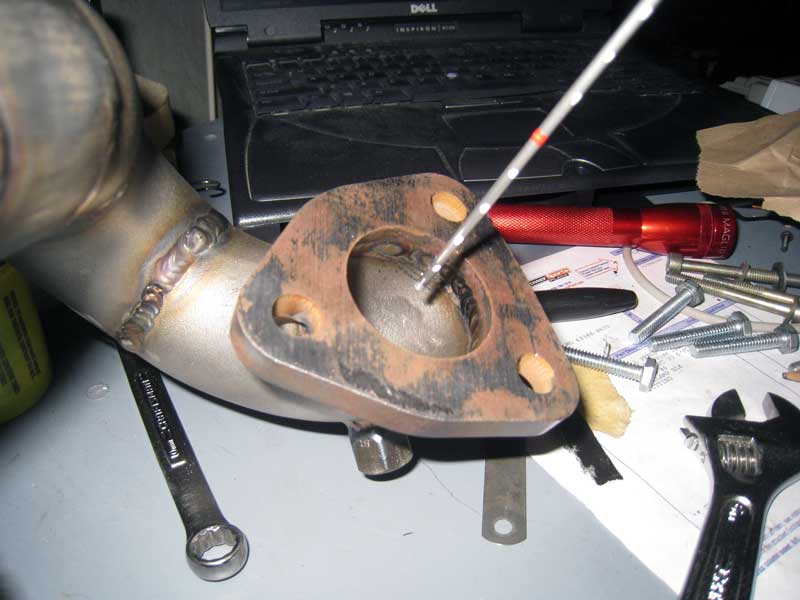
The velocity probe was placed perpendicular to the plane of the exhaust manifold outlet approximately intersecting the plane across the outlet opening.
Due to the interaction of the airflow with the probe the readings varied slightly. To try and minimize the affect of this variation 10 samples were taken for the AWE and SRM manifolds and averaged. The higher velocity from the stock exhaust manifold caused greater variation and therefore 20 samples were averaged.
Only the middle primary was tested.
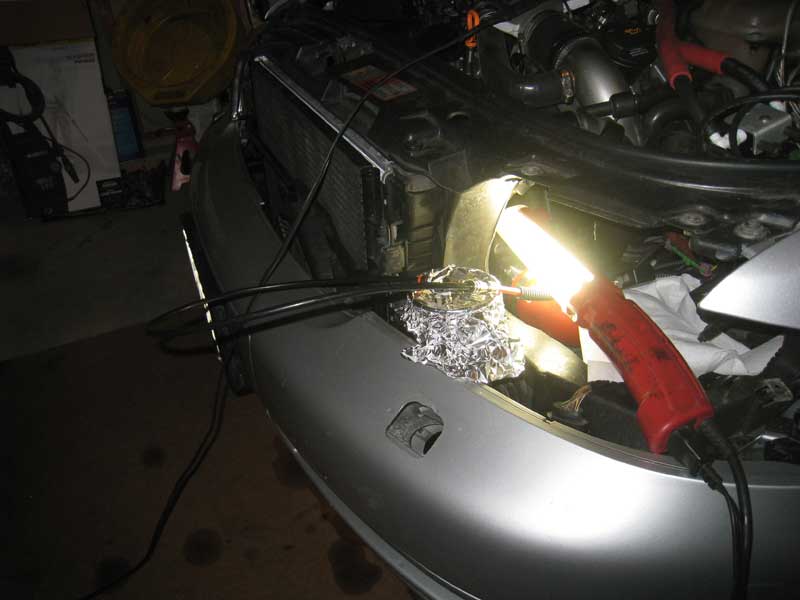
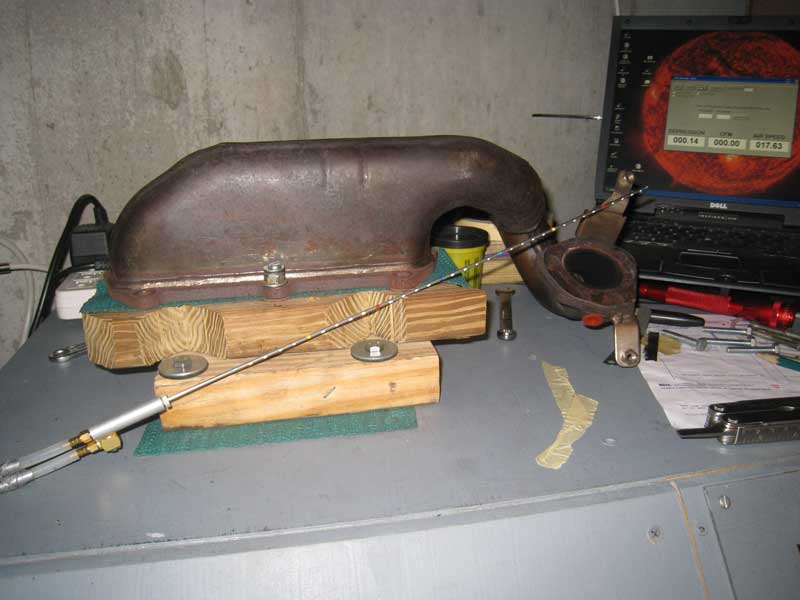
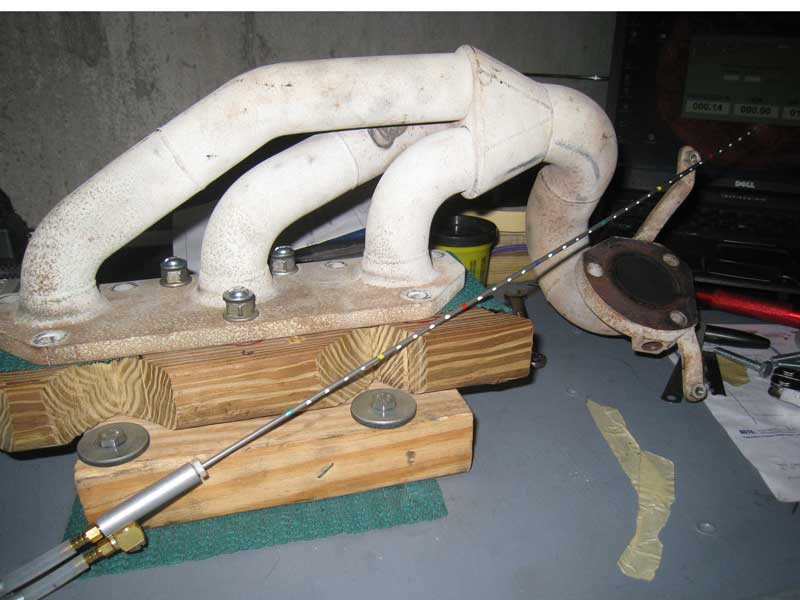
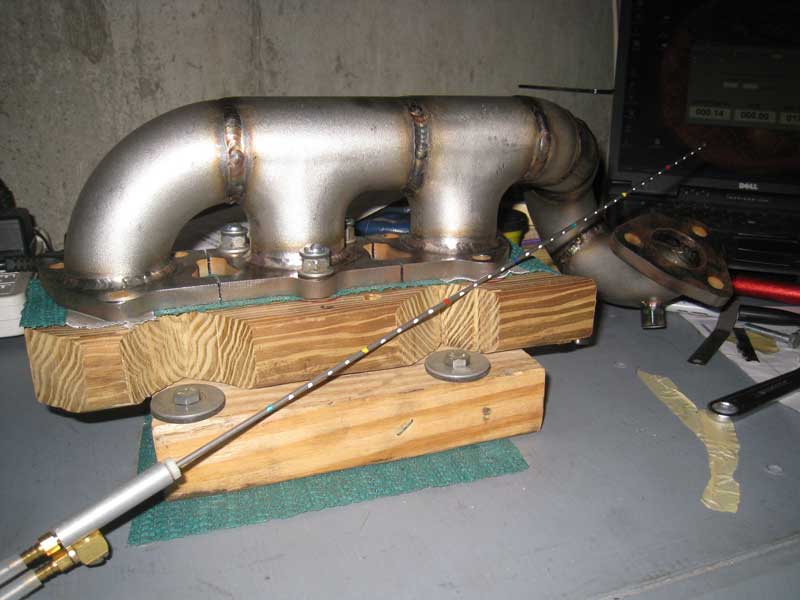
Here is each product on the bench as the tests were being conducted.
The Results
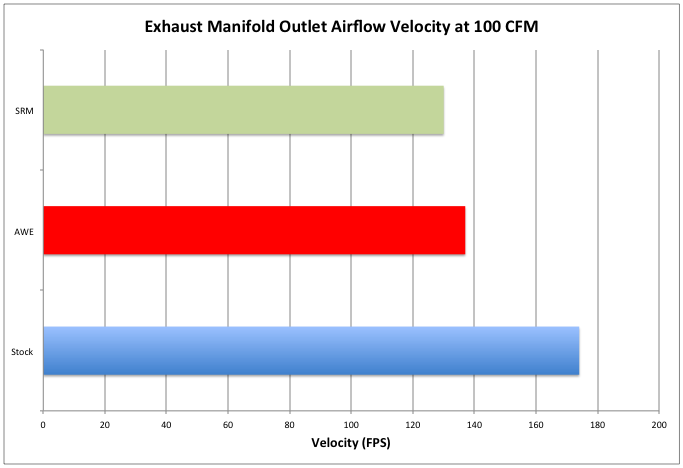
Based on the respective diameters of the primary runners and the outlet diameter of the manifolds the results are not surprising.