Hot Air Intake Test

Curious about how hot things get under the hood in the area near the airbox, and what the affect on the engine intake air temperature is, I was debating purchasing a cone filter to stick on the end of my MAF housing and record some intake air temperatures.

I wasn’t thrilled about the idea of spending money on an air intake that I didn’t have a strong interest in using permanently on my S4.  Then while looking at the engine compartment it occurred to me that I could simulate the cone filter “hot air” intake by removing the snorkel from the stock airbox.

B5 S4 "Hot Air" Intake Setup using Stock Airbox
B5 S4 “Hot Air” Intake Setup using Stock Airbox

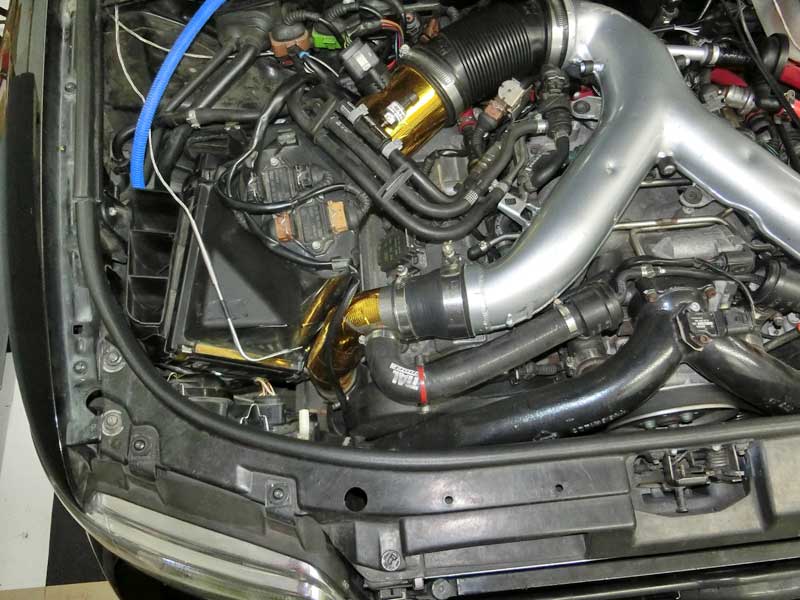
With no snorkel to route cool air from the front of the car to the airbox this arrangement would need to draw air from the same space inside the engine compartment that a cone filter does.

I taped a temperature sensor probe to the airbox sticking out into some open space so that I could record engine compartment air temperature in the vicinity of the airbox.  I also had a probe placed in the inlet piping just prior to the turbocharger compressor housing and another in the hard pipe between the turbocharger compressor outlet and the intercooler.

Additionally I would log the Intake Air Temperature at the intake manifold via the cars temperature sensor, and I also noted ambient air temperatures displayed on the instrument panel a couple of times during the test.

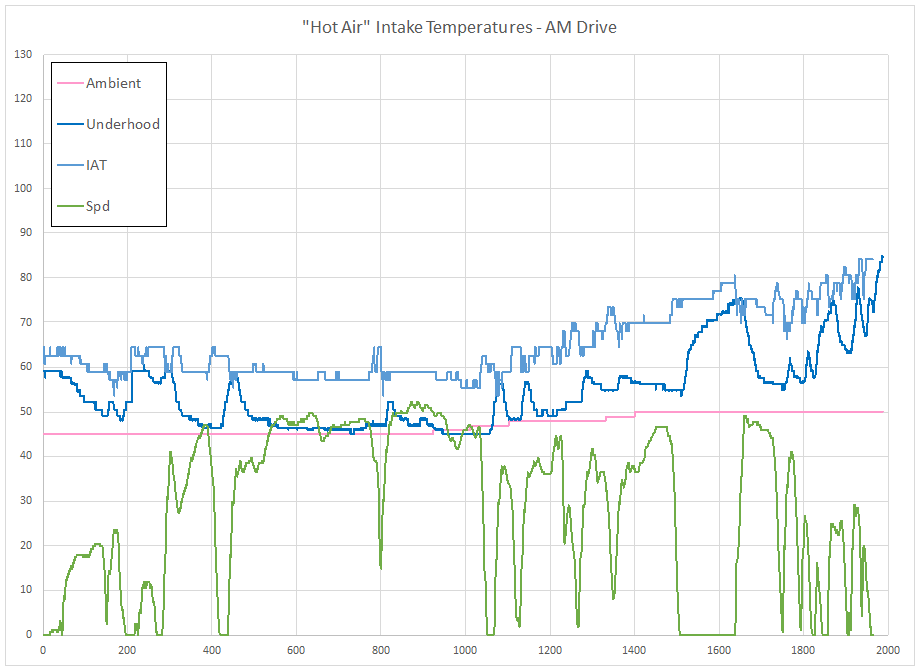
The route I drove was the same that I took when testing gold foil wrap on several intake parts, the morning drive starting as mostly steady state and then getting into stop and go traffic.  The ambient temperature was about 20 degrees F cooler in the morning than the afternoon.  The temperature readings for this morning drive are shown below, along with the drive speed in MPH.

Hot Air Intake Test Day 1 AM Drive

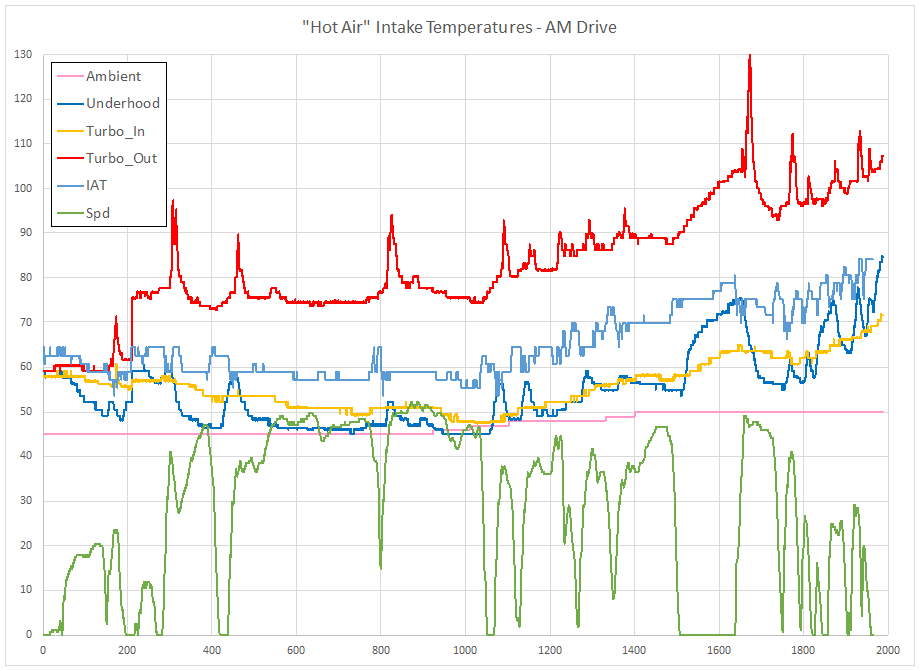
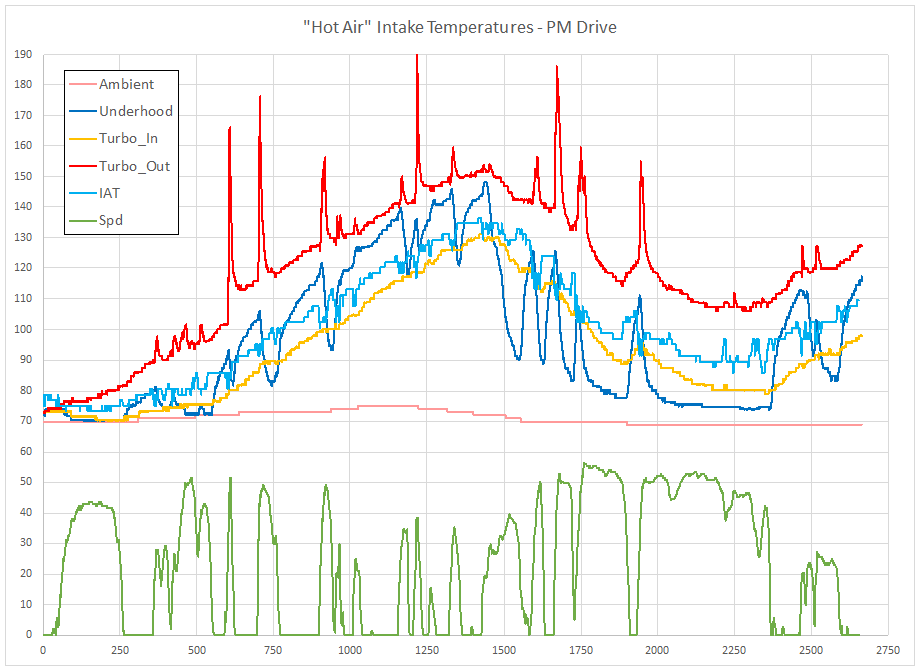
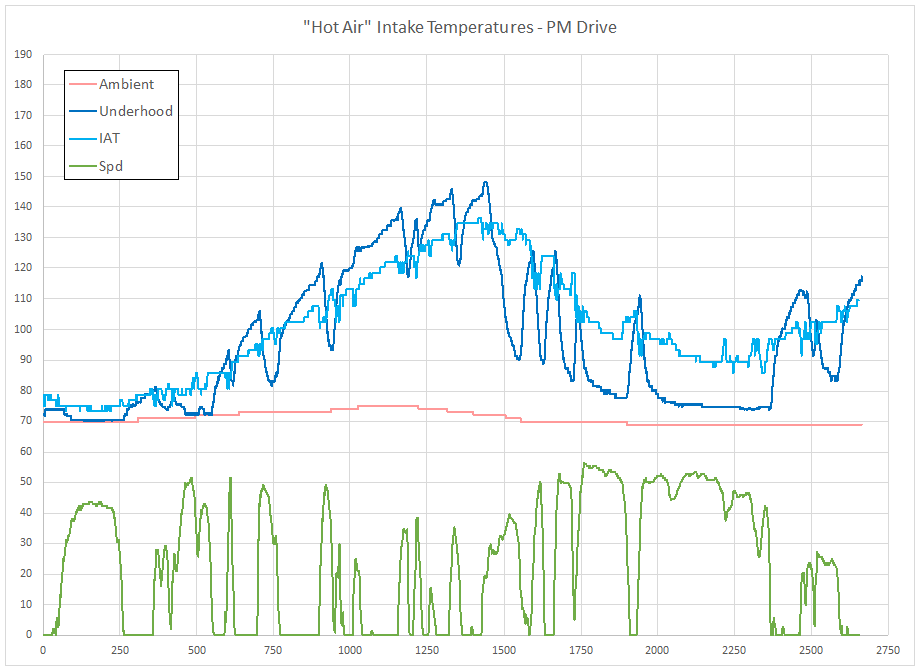
The route was traced back the other direction in the afternoon resulting in the stop and go traffic first, followed by the steady state driving.  Ambient temperatures were greater during this drive.

Results are shown below:

Hot Air Intake Day 1 - PM
Hot Air Intake Day 1 – PM

The charts below are for morning and afternoon without the inclusion of turbo in and out temperatures.

Hot Air Intake Day 1 AM
Hot Air Intake Day 1 PM

Next up will be to repeat the drive with the forward most part of the snorkel tube installed, still leaving the airbox unattached to the intake.

Inertial Dynamometer and Turbocharger Boost Onset

For a while I have been trying to reconcile the performance measurements taken of my car on a DynoJet dynamometer with what I have experienced when driving on the road.

I brought my S4 in to be dyno’d with the S4’s stock K03 turbochargers and a higher performance engine tune, and a few weeks later returned with the larger RS4 K04 turbochargers installed.

Post activity on the dyno

The results that were puzzling to me were the torque curves, the initial torque onset was very similar for these two different size turbochargers.

K03 (lower) vs K04 (upper) Torque Curves

The BorgWarner S4 K03 has a compressor of 36/50 mm and turbine of 45/40 mm.  By comparison the BorgWarner RS4 K04 compressor is 40/51 mm and turbine is 50/42 mm.  Just based on the relative sizes the K03 should generate boost more rapidly than the K04, leading to a quicker rise in torque.

Compressor and Turbine Wheel example

The faster boost onset of the K03 vs K04  has been ‘community knowledge’ for some time, and measurements I have made showing the time for boost to rise from 2-11 psi have confirmed this quicker ‘spool-up’.

K03 vs K04 2-11 psi boost rise time

So if the K03 clearly spools quicker, then why isn’t it generating more torque ‘down low’.

I compared the boost curves from the dyno sessions:

K03 (lower) vs K04 (upper) boost onset on DynoJet
K03 vs K04 boost onset on DynoJet

Hmm, that’s odd, the K03’s should be boosting quicker.  This got me thinking about how the data is being presented, the dyno is showing results versus engine speed and my street data is versus time.  I wonder how the boost onset looks on the dyno if it is shown versus time:

K03 vs K04 Dyno Boost vs Time

That is more along the lines of what I would expect to see based on my street measurements of 2-11 psi time, and what car drivers have experienced, the K03 is boosting more quickly.

Now going back to the DynoJet results, luckily I have the data logs from the Dyno and the WinPep software to be able to review the data.  I changed the x-axis from the normally shown Engine Speed, to the almost never used Time value:

K03 vs K04 DynoJet Results plotted versus Time

This result matches with user experience.  Because we perceive events taking place through the passage of time, after an equivalent time passage the K03 setup is at a higher torque production, which a driver feels.

At least that is the case for a few seconds, until as is shown at ~3.5 seconds, the K04’s overtake the K03’s.

Conclusion:

The take away from this is that when looking at dyno charts from an Inertial Dyno, that are expressed versus engine speed, you should be careful about assuming that the initial ‘boost hit’ is being accurately represented in a way you as the driver will experience.

Showing the torque curves of competing turbochargers versus Time will likely give a better representation of the seat of the pants difference that the two will produce.