
For a while I have been trying to reconcile the performance measurements taken of my car on a DynoJet dynamometer with what I have experienced when driving on the road.
I brought my S4 in to be dyno’d with the S4’s stock K03 turbochargers and a higher performance engine tune, and a few weeks later returned with the larger RS4 K04 turbochargers installed.

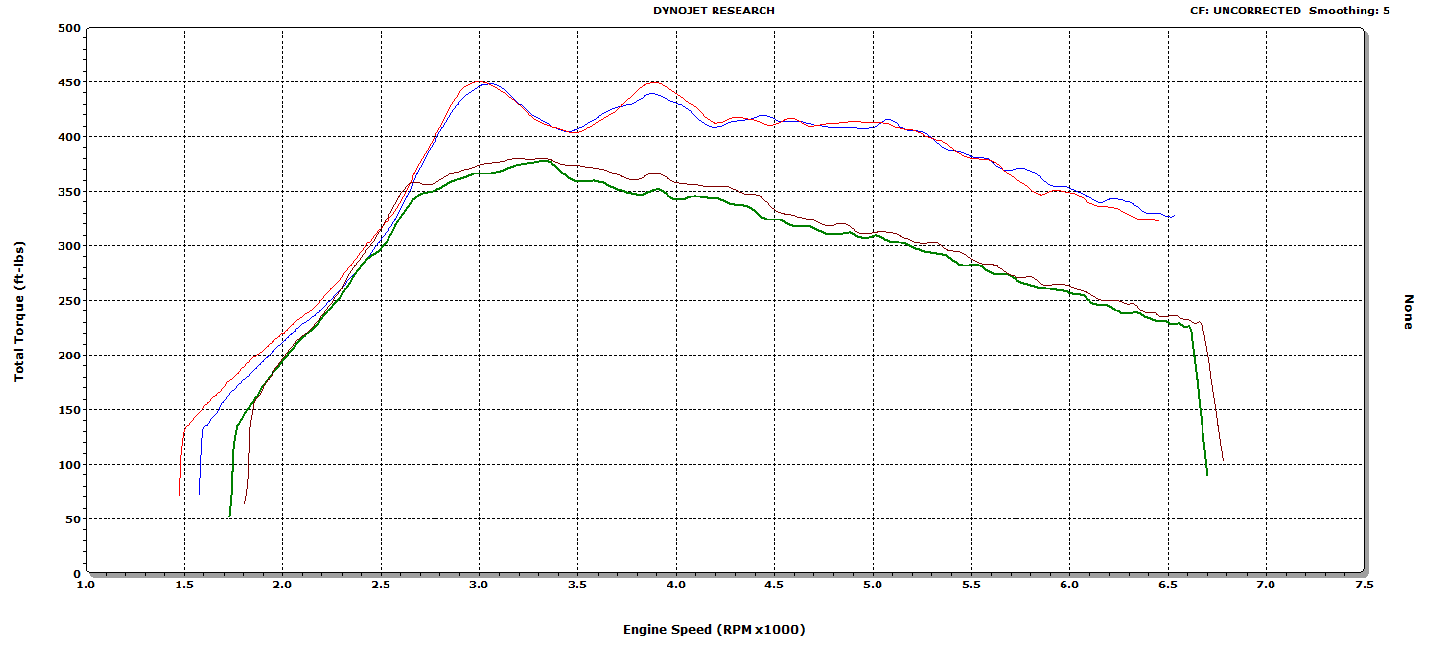
The results that were puzzling to me were the torque curves, the initial torque onset was very similar for these two different size turbochargers.
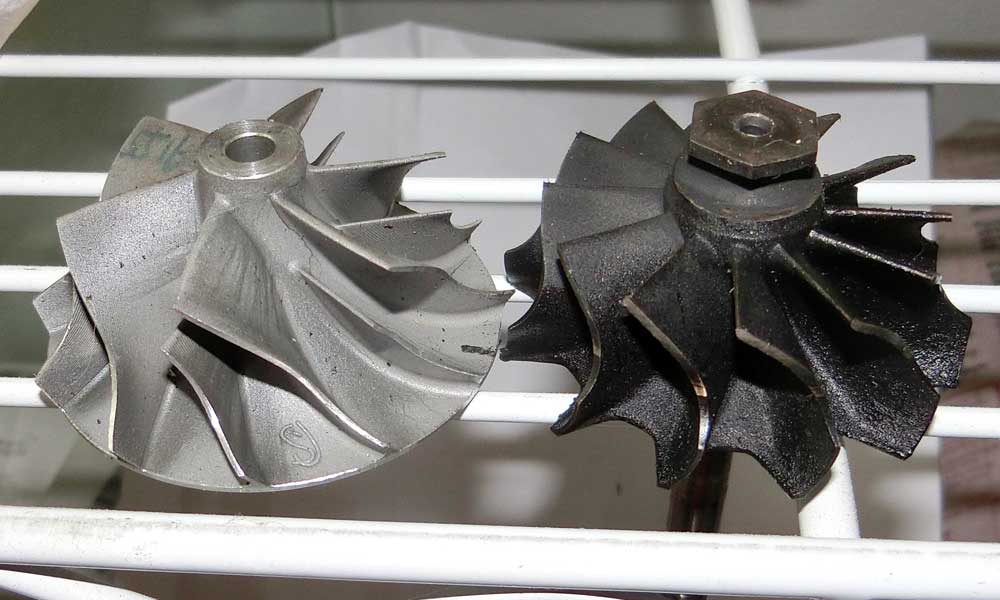
The BorgWarner S4 K03 has a compressor of 36/50 mm and turbine of 45/40 mm. By comparison the BorgWarner RS4 K04 compressor is 40/51 mm and turbine is 50/42 mm. Just based on the relative sizes the K03 should generate boost more rapidly than the K04, leading to a quicker rise in torque.
The faster boost onset of the K03 vs K04 has been ‘community knowledge’ for some time, and measurements I have made showing the time for boost to rise from 2-11 psi have confirmed this quicker ‘spool-up’.

So if the K03 clearly spools quicker, then why isn’t it generating more torque ‘down low’.
I compared the boost curves from the dyno sessions:
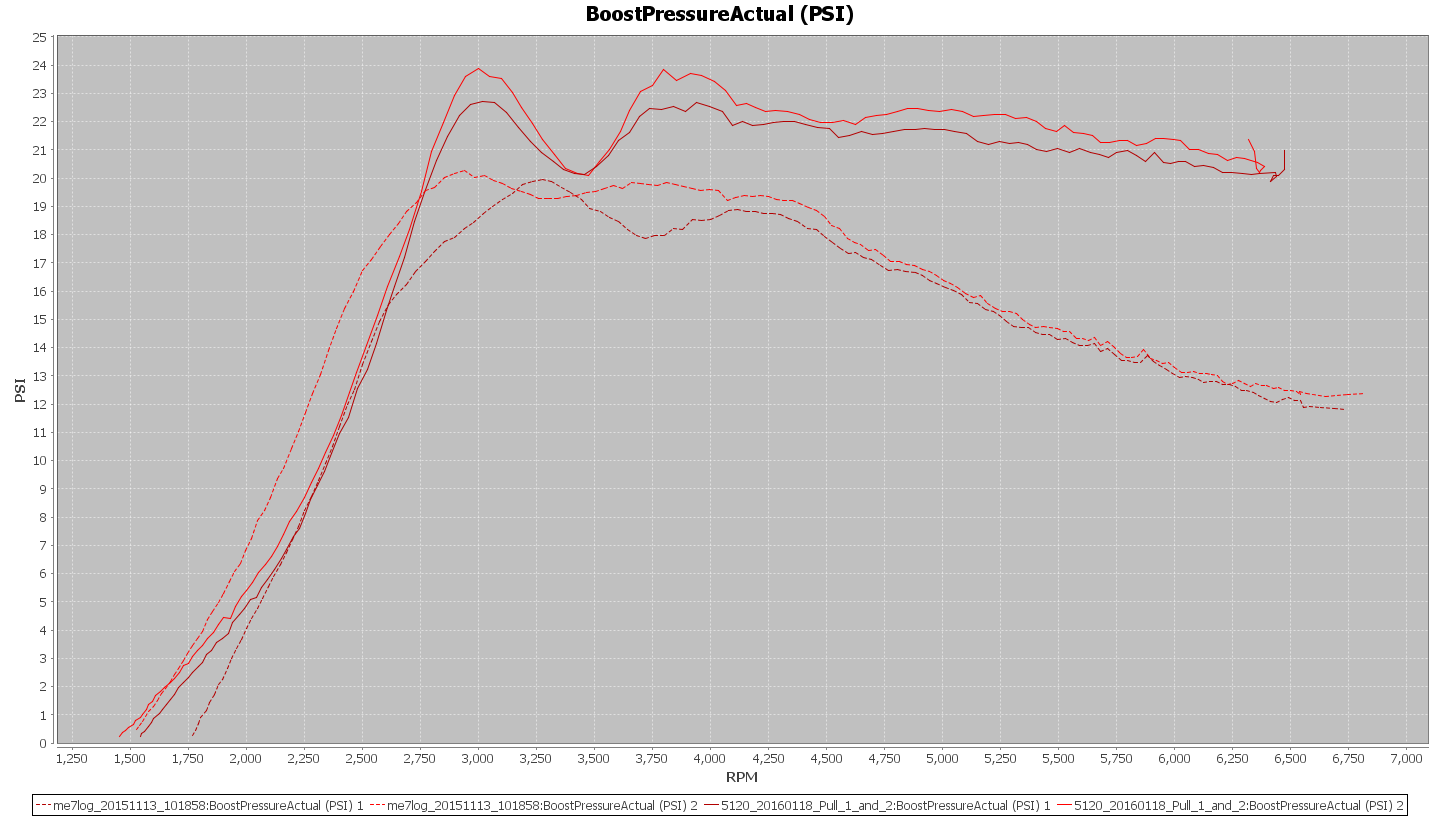
Hmm, that’s odd, the K03’s should be boosting quicker. This got me thinking about how the data is being presented, the dyno is showing results versus engine speed and my street data is versus time. I wonder how the boost onset looks on the dyno if it is shown versus time:
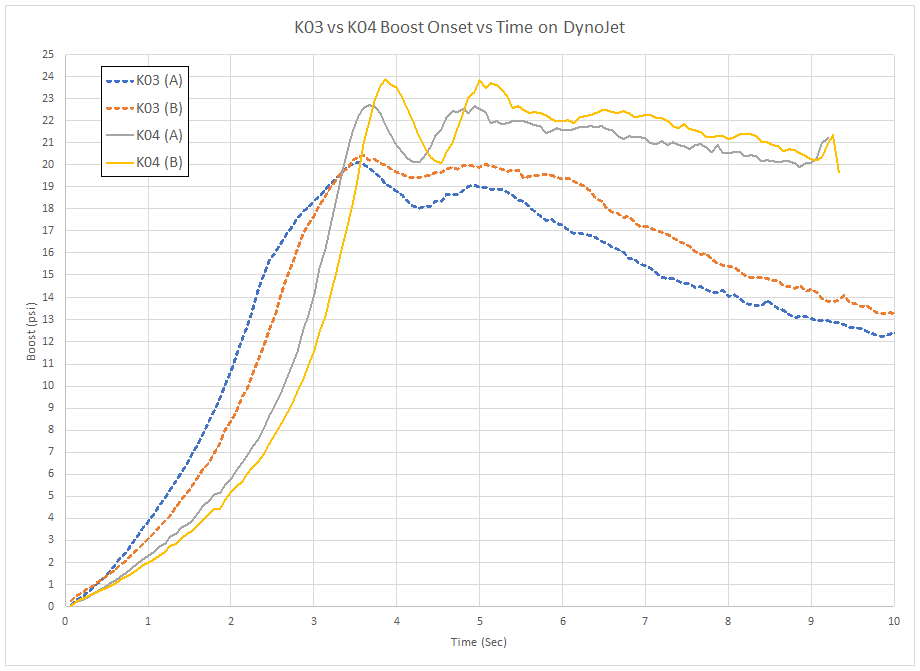
That is more along the lines of what I would expect to see based on my street measurements of 2-11 psi time, and what car drivers have experienced, the K03 is boosting more quickly.
Now going back to the DynoJet results, luckily I have the data logs from the Dyno and the WinPep software to be able to review the data. I changed the x-axis from the normally shown Engine Speed, to the almost never used Time value:
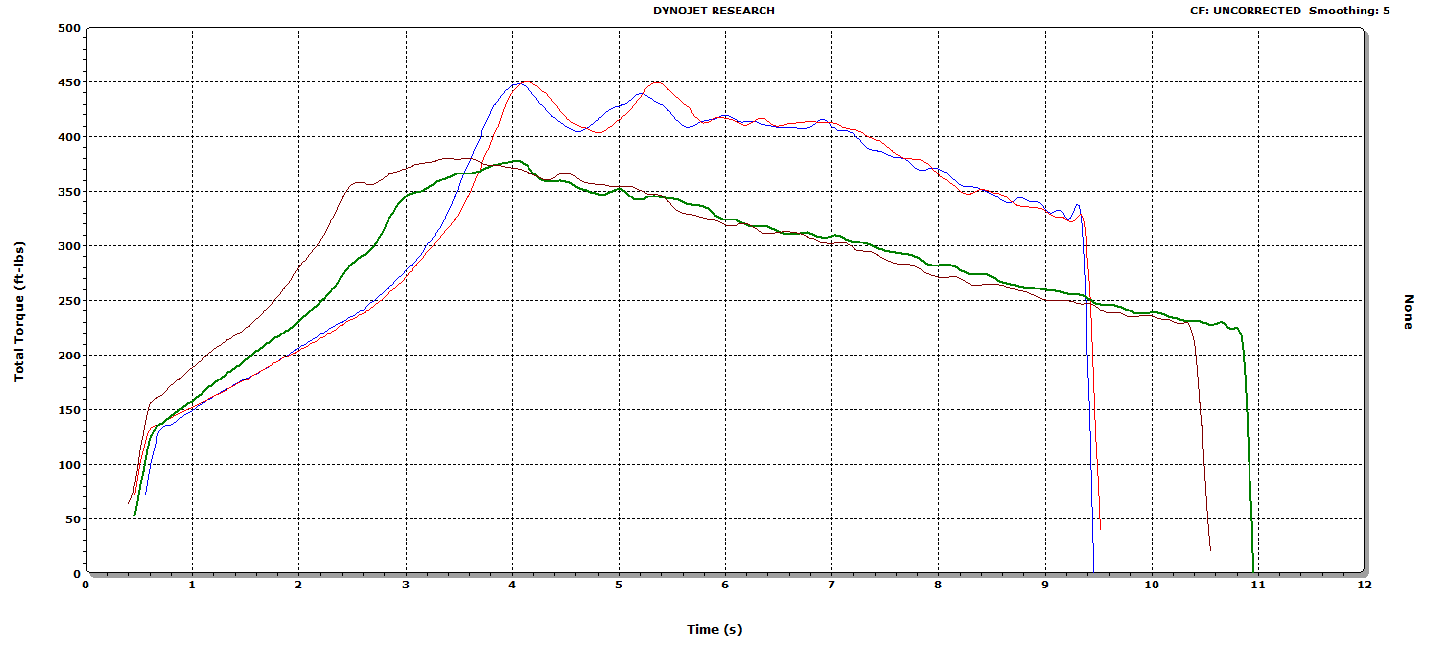
This result matches with user experience. Because we perceive events taking place through the passage of time, after an equivalent time passage the K03 setup is at a higher torque production, which a driver feels.
At least that is the case for a few seconds, until as is shown at ~3.5 seconds, the K04’s overtake the K03’s.
Conclusion:
The take away from this is that when looking at dyno charts from an Inertial Dyno, that are expressed versus engine speed, you should be careful about assuming that the initial ‘boost hit’ is being accurately represented in a way you as the driver will experience.
Showing the torque curves of competing turbochargers versus Time will likely give a better representation of the seat of the pants difference that the two will produce.