Based upon some of the latest flow testing I have updated the composite pressure drop chart. The goal of the chart is to show the relative contributions of various components to the overall pressure drop experienced pre and post turbo and help guide purchase decisions.
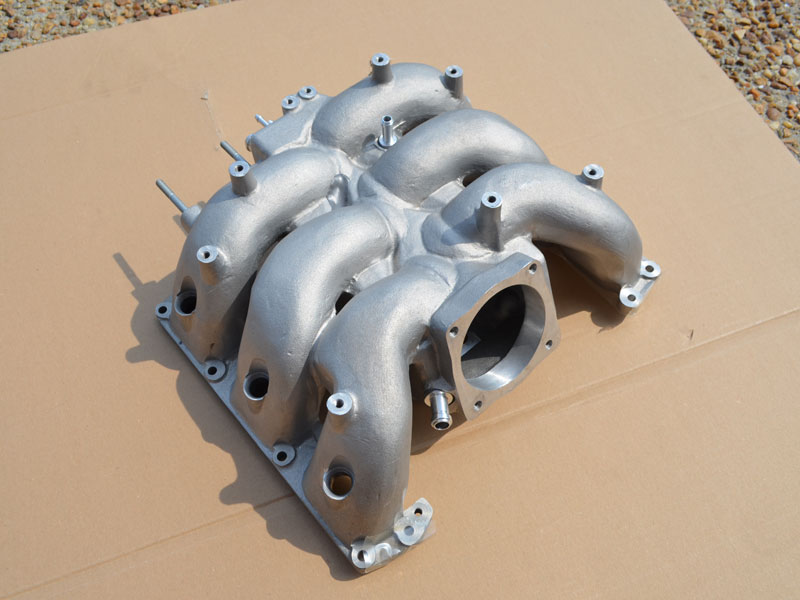
Adding the flow testing of the intake manifold is problematic due to the way that air flows through the part when operating. Tests on the flow bench consisted of single runner and all runners open, neither of which accurately reflects the operating conditions on the car. As a compromise the average flow through a single runner at 250 CFM was used to establish the pressure loss value used on the chart. Be aware that the magnitude of contribution from the intake manifold could be quite a bit different than shown below.