This information was originally published on Audiworld in September of 2006.
IPP Intercooler Test Plan
Overview
The overall objective of this test is to determine if the Innovative Performance Products S4 intercoolers provide any measurable gains in temperature drop performance compared to the stock intercoolers supplied with the S4.
The first stage will consist of a bench test of limited scope that will evaluate the two intercoolers separate from the vehicle and under controlled test conditions.
The second stage of testing will involve evaluating the performance of the two intercoolers when installed on an S4. This will involve several separate tests operating the S4 under different conditions.
Stage I
Bench test
Objective – For both intercoolers determine the rate at which they heat up when a low volume of hot air is passed through the intercooler core without any cooling air being forced over the intercooler. Determine at what time and temperature the intercoolers reach steady state, this will be when the recorded temperature no longer rises. Activate a fan to provide cooling air over the intercooler and record the rate at which the measured outlet temperature drops, and at what time and temperature reaches steady state.
Procedure – Set the intercoolers on the floor of an enclosed garage and attach a 1000W hair dryer to the inlet of the intercooler. Place a temperature measuring device in the outlet of the intercooler without touching the intercooler. Record the starting temperature and then turn on the hair dryer while starting the time piece. Log the temperature every 30 seconds. Once the temperature at the outlet has stopped rising activate the cooling fan. Continue to log the temperature until it has stopped decreasing.
Configuration – The intercoolers will be placed on their side on the garage floor with the hair dryer exhaust placed into the inlet of the intercooler and then secured in place so it will not move and air will not escape through any open space around the hair dryer exhaust. The temperature measuring device will be placed in the outlet of the intercooler without touching the sides of the intercooler. The cooling fan will be placed approximately three feet in front of the intercooler with the air blowing directly at the intercooler. The intercooler shrouds will not be employed in the test.
Constraints – Test was limited to charge air flow rates equating to an estimated 20 g/s. This is barely above what would be found at an engine speed of 2000 rpm under minimal load. Under full throttle flow rates are over ten times this amount. The output from the hair dryer was approximately 250F. This temperature did not change, which does not reflect the manner in which the air temperature varies on the car. The affect on the hair dryer output, both the temperature and volume, from back pressure produced by the intercooler core is unknown. The cooling fan produced a wind speed approximately 10-15 mph. This is far below what would be experienced under typical driving conditions. Without including the intercooler shrouds in the test the quantity of air passing over the intercooler was further reduced compared to what would be encountered under normal driving conditions. The intercoolers were set on their side on a floor, a much different placement than would be found in the vehicle.
Results – The IPP intercoolers took longer to rise in temperature than the stock intercoolers. The steady state temperature reached without any cooling airflow was lower with the IPP intercoolers than with the stock intercoolers. Once the cooling airflow was begun the IPP intercoolers decreased in temperature more rapidly, and fell to a lower temperature than the stock intercoolers.

Conclusion – For the conditions of the bench test the IPP intercooler appeared to perform better than the stock S4 intercooler with respect to resisting heat build up and ability to dissipate heat.
Stage II
Cruise Test
Objective – Determine at what temperature the intercooler settles when driven at high speed steady state conditions.
Procedure – Drive the car on a highway at steady speeds between 60-70 mph and log the intake air temperature, vehicle speed, rpm, and intake mass airflow.
Configuration – The intercoolers were installed in an S4 in the appropriate location using the stock intercooler shrouds.
Constraints – Since the test was run on a public road, holding a steady speed throughout the entire test was difficult. Because installing the intercoolers was not a quick change the test was not a back-to-back evaluation. To minimize environmental affects two days with similar conditions were chosen for conducting the tests. The affect of wind could not be accounted for.
Results – The chart below shows that the temperature difference between the two intercoolers was minimal. The minor differences that did arise had no obvious cause.

Conclusion – Neither intercooler showed better performance versus the other on this test.
Speed Test
Objective – Determine at what steady speed the intercooler would be incapable of dissipating heat rapidly enough to prevent the intake air temperature from rising.
Procedure – Drive the car on a highway at a steady speed and steady rpm, in this test 3000 rpm was chosen, while recording intake air temperature. Shift to a lower gear and maintain a speed that would keep the engine rpm at 3000. Shift once more to a lower gear and continue to maintain 3000 rpm. Recordings would be taken in each gear for several minutes.
Configuration – The intercoolers were installed in the car and configured with the stock intercooler shrouds. A suitable road was chosen that would allow for steady uninterrupted travel at the chosen test speeds. Tests were performed under similar environmental conditions.
Constraints – The road selected was a public road where the presence of other vehicles could affect the test cars ability to maintain a steady speed. Environmental conditions, such as wind could not be controlled.
Results – The test began in 4th gear at 55 mph. The intake air temperature for both intercoolers remained the same initially. After two and one half minutes the intake air temperature with the IPP intercoolers rose slightly.
Shifting to the 3rd gear run took slightly longer with the stock intercoolers than the IPP intercoolers, so the results on the chart have been shifted accordingly to make up for this time difference and allow the regions of similar speed to correspond in a way that makes comparison easier. The stock intercoolers were driven at 42 mph and the IPP intercoolers at 44 mph. In the case of both intercoolers the reduction in speed is accompanied by an increase of the intake air temperature. The temperature increase is about the same for each intercooler. After approximately one minute the IPP intercooler shows an increase of the intake air temperature that continues for the duration of the time at 44 mph. The stock intercoolers maintain a steady temperature at this speed.

After shifting to 2nd gear and at 28 mph the stock intercoolers show an immediate and continued increase of intake air temperature. The IPP intercoolers maintain a constant temperature for just over one half a minute before the intake air temperatures start to rise at a rate noticeably faster than the stock intercoolers.
Conclusion – Threshold speed for the stock intercoolers appears to lie between 42 and 28 mph. The threshold speed for the IPP intercoolers appears to lie between 55 and 44 mph. The stock intercoolers performed better than the IPP intercoolers on this test.
FATS Tests
Objective – Evaluate the intake air temperature response over a short duration full throttle acceleration and then during the thirty seconds following the moment when maximum rpm was reached. The purpose is to show how well each intercooler absorbs a short duration of high temperature high volume air, and how quickly and effectively they return the intake air back to a lower temperature. The second purpose is to compare the time to accelerate from 4200 rpm to 6500 rpm (FATS test) in order to determine if there are any acceleration performance gains resulting from either intercooler.
Procedure –The car will be moving in third gear around 2500-3000 rpm. The accelerator pedal will be fully depressed and held down until 6500 rpm is reached. The car will then slow to between 50-65 mph and maintain that speed for at least 30 seconds.
Configuration – The intercoolers remain the same as in the other Stage II tests. The car will be tested on a flat stretch of road with the same quantity of fuel in the gas tank and same weight of other items in the vehicle for each test.
Constraints – The environmental factors most likely to impact the test results are wind velocity and air temperature. The test will be conducted on days with similar conditions. The road chosen for the test will be as close to flat as is reasonable given the other requirements for a suitable road. The condition of the car will be as similar between tests as can be maintained, ie. Fuel level and excess items in the vehicle.
Results – Two sets of FATS tests were performed on the IPP intercoolers because the results were unexpected. After evaluating the results more closely it became apparent that the cars engine control unit was reducing the throttle plate position in response to the manifold air pressure sensor detecting greater than requested boost levels, aka Throttle Cut. This occurred on 2 out of 5 stock intercooler tests, and all of the IPP intercooler tests.
While this occurrence invalidated the timed results from the FATS runs it did not do the same for the intake air temperature results. When throttle cut occurs the car continues to accelerate, and reaches the upper goal of 6500 rpm, the difference was that it took longer than would have if the throttle plate had remained open fully. Because the test was not recording boost level it’s not possible to evaluate if the boost level dropped. Additionally, throttle cut did not always occur at the same rpm. On some runs it occurred around 3500 rpm and others not until 6000 rpm. Therefore the affect of the throttle cut on the temperature results can not be determined for certain. It does not seem likely that the intake air temperatures would have been less if the car been producing full boost. Thus, the throttle cut may have led to lower intake air temperatures than would have occurred otherwise, and since this occurred more often with the IPP intercoolers, it’s not unreasonable to continue the comparison keeping in mind that the IPP intercoolers may have had an advantage based on lower boost levels at the higher engine speeds.
The chart above shows the three sets of test series. This is the uninterrupted data that was collected from the start of the test to the end of the test. The most notable observation from this chart is the lack of any significant differences between the three tests.

The chart above shows how the intake air temperature rose with the increase in engine rpm. Once again the overall observation is that there is great similarity to how the temperature rises during each test series for each intercooler. Neither the stock intercooler nor IPP intercooler appears to significantly outperform the other with respect to resisting temperature rise.
The results of these tests were tabulated by taking the peak temperature reading at the maximum rpm and subtracting the lowest temperature recorded after acceleration began. This gave a temperature rise for each run. The chart below shows this tabulated information. The most telling information is the mean and median values for temperature rise. These are represented by the small blue circle with the plus sign (+) for the mean, and small blue circle with (x) for the median. The two values are close together on each test, indicating that even though there are not a large number of samples, the values are distributed proportionally around the mean. There are no outliers skewing the value of the mean.

Because the starting intake air temperature was very similar for each test, the temperature rise was not affected by extreme differences in starting temperature.
The results show that the difference in temperature rise between the stock intercooler and IPP intercooler on the first test was 1.5F. The difference between the stock intercooler and IPP intercooler on the second test was 0.3F. The confidence interval, represented by the blue lined brackets shows that there is a reasonable likelihood that there is no difference between the mean values at all, that is, that the intercoolers perform the same.
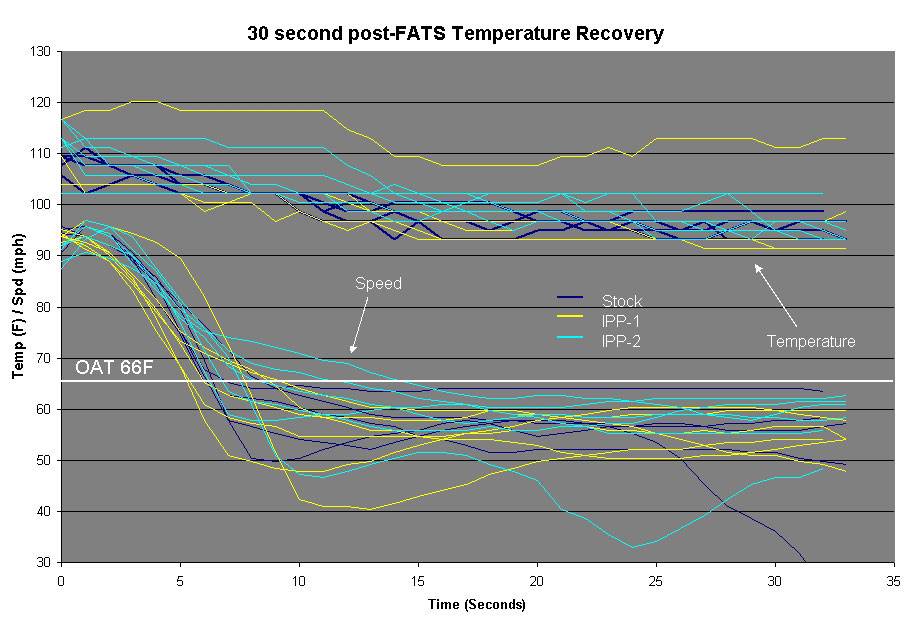
The next chart below shows the period following the FATS run. It shows how quickly the intercooler reduces the intake charge temperature, which at this point is elevated because the intercooler is the source of heat warming the intake charge. It’s an indication of how quickly the intercooler can dissipate to the atmosphere the heat energy that was stored during the boost event.
There are no obvious differences in the rates at which the two intercoolers dissipate stored heat.
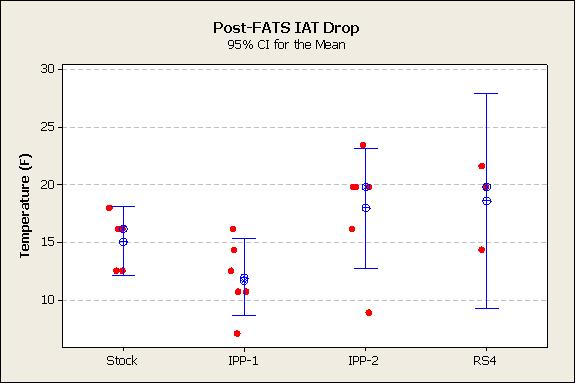
The following chart shows a summary of the temperature drops. The maximum temperature reached during the FATS test was used as the starting point and the temperature thirty seconds later was the end point. The stock intercooler lowered the temperate 15 degrees F on average. On the first test series the IPP intercooler lowered the temperature 12F and on the second test lowered the temperature 18F. As was the case with the temperature rise, the average values are close enough together to assume there is no significant difference in the intercoolers performance in terms of post-FATS test temperature drop after thirty seconds of cool down driving.

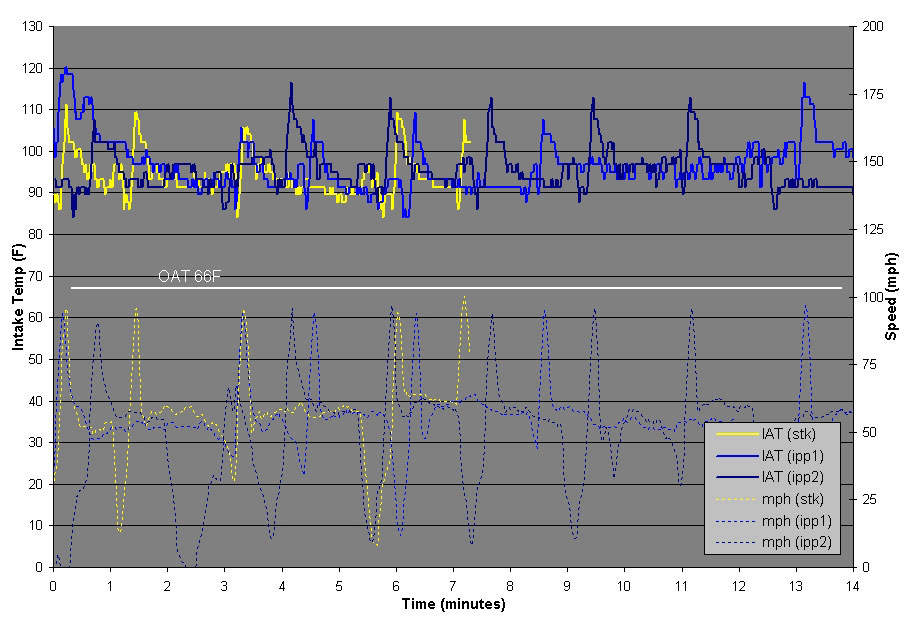
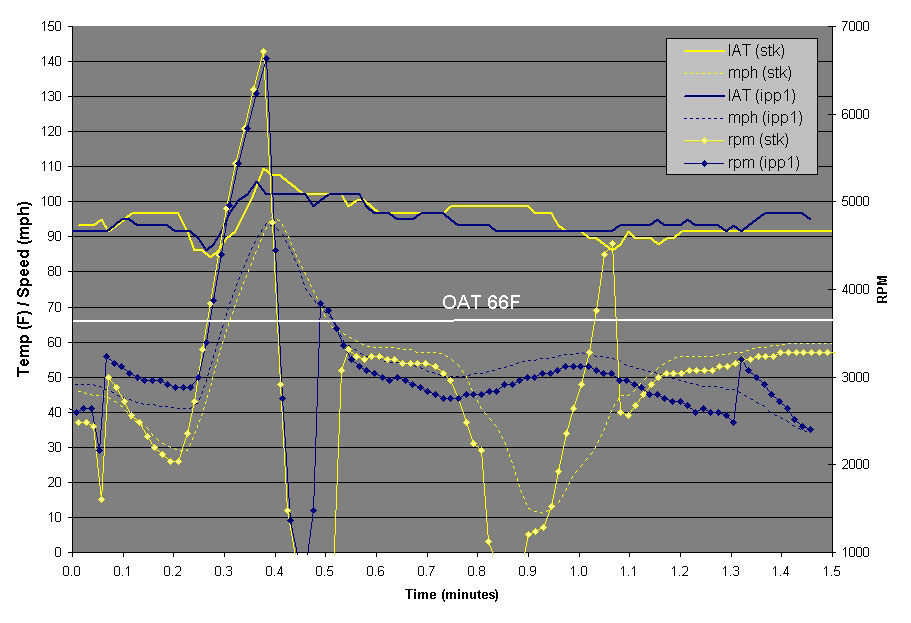
The chart below shows a representative FATS run for each intercooler, including the vehicles speed and engine rpm. It is included to illustrate the temperature profile that the intake air temperature follows over a FATS test with each of the intercoolers. The most notable aspect of the chart is the similarity between intake air temperature curves for the two intercoolers.
Conclusion – Neither intercooler showed greater performance versus the other on this series of tests.
Final Conclusions – The results obtained from this series of tests fails to definitively show that one intercooler performs better than the other with regard to resisting heat build up or dissipating stored heat energy.
The IPP intercoolers performed better on the bench test, the stock intercoolers performed better on the road speed test where minimum vehicle speed for heat dissipation was evaluated. The road cruise test and FATS tests showed no significant differences between the intercoolers.
Discussion on results – The results on the bench test were what were expected given the fact that the IPP intercoolers are supposed to be a more effective replacement for the S4’s stock intercoolers. The results appeared reasonable until the road tests showed that there might not be such a clear difference in performance between these two intercoolers. The question then became, why were bench test results so different than what was occurring on the road? For one possible answer it becomes necessary to consider pressure drop.
Pressure drop is an important consideration when designing an intercooler. Pressure drop is the resistance that the intercooler presents to the charge air flow; it is the amount of pressure that must be applied to the charge air in order to push it through the intercooler. All else being equal, less pressure drop is better because the turbocharger then has less work to do overcoming that resistance. The catch is that all else is not equal. Pressure drop usually is a result of the internal core design which functions to lower the temperature of the charge air. One intercooler with a greater pressure drop than another might be more effective at cooling the charge air, and thus a decision must be made about how much pressure drop to have versus how much temperature drop is desired.
Something which was brought up during the presentation of the bench test results was that a small motor such as that in the hair dryer could be significantly affected by back pressure through the intercooler core.
Going into this test indications were that the IPP intercoolers resulted in less of a pressure drop across the intercooler. It seems plausible that if the stock intercooler causes more back pressure, resistance to airflow could have caused the temperature of the air exiting the hair dryer into the stock intercooler to be greater than that flowing through the IPP intercooler. This would explain why the temperature of the stock intercooler rose faster and farther than the IPP intercooler.
Another possible explanation comes from the intercoolers ability to transfer heat from the core fins to ambient air flowing through the core. If the stock intercooler were able to dissipate heat more effectively, once the intercoolers were tested on the road this advantage could have come into play. The fact that the threshold speed, where the intercooler could no longer keep the intake charge temperature constant, was lower for the stock intercooler, suggests that the stock intercooler is more efficient at dissipating heat with quantities of air that are encountered while driving.
The results from the FATS test support the theory that the IPP intercoolers cause less of a pressure drop. The fact that the test vehicle encountered over-boost throttle cut on every IPP FATS run, and only two of the five stock intercooler tests seems to validate this. Oddly, with less of a pressure drop the turbocharger compressor should function more efficiently, resulting in a lower temperature of the charge air at the compressor outlet. In the case of the IPP intercoolers this is not translating into a reduction in temperature at the intake air temperature sensor compared to the stock intercoolers.
How might the pressure difference affect the FATS test times? One way to estimate is to look at the data that was collected up to the engine speed where throttle cut began. The chart below shows this data.

No significant differences appear over the engine speed range shown, but throttle cut was occurring just past the halfway point of the test so it is not possible to accurate estimate the final results.
One final note concerning pressure drop. As was mentioned earlier, all else being equal less pressure drop is desirable. But if the reduced pressure drop comes at the cost of reduced temperature drop, the particular application of the intercooler should be considered. If the boost required from the turbocharger is well within the normal operating range of the turbo compressor, even accounting for the pressure increase required to overcome the intercoolers back pressure, it may be prudent to select an intercooler based on temperature drop. Ultimately what matters most is the temperature of the intake charge air that enters the engine. A more efficient intercooler will cool the charge air temperature more than a less efficient intercooler, and as intake air temperatures rise the more efficient intercooler will cool the charge air a greater amount.
The chart below illustrates some of these points with a theoretical look at intercooler pressure drop and efficiency.

The addition of heat through compression, and the removal of that heat by the intercooler can be modeled fairly easily. In the chart I have looked at the theoretical intake air temperature for several different scenarios; a turbocharger producing 10, 15, and 20 psi of boost pressure, and an intercooler with a pressure drop of 1 psi and 2.5 psi, and efficiencies ranging from 60% to 80%.
A few points about the results on the chart. As would be expected, with increasing efficiency and decreasing pressure drop the intake air temperature is lowered. The intake air temperature also drops when the boost pressure is lowered. What is interesting is that as the boost pressure rises the amount of temperature drop for a more efficient intercooler becomes greater, but as the boost pressure rises the temperature drop from improving the pressure loss decreases. What this indicates is that for high boost pressure applications the intercooler efficiency is more important than pressure losses, assuming the pressure losses are not extreme and the compressor is not operating outside its normal performance envelope. This example looks at a fairly significant change in pressure loss, a 150% increase.