Interest in demonstrating a relationship between exhaust system back pressure and boost onset led me to run a test where I measured each while applying a covering over the exhaust pipe outlet.
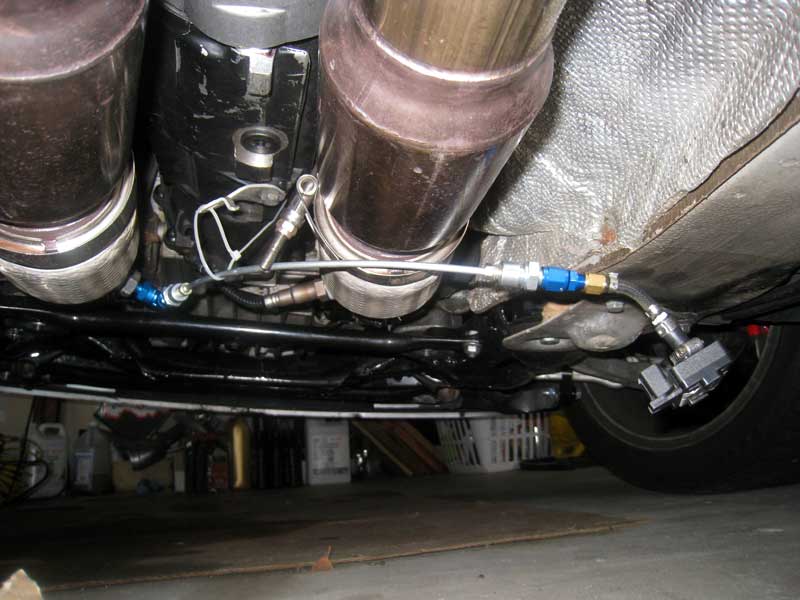
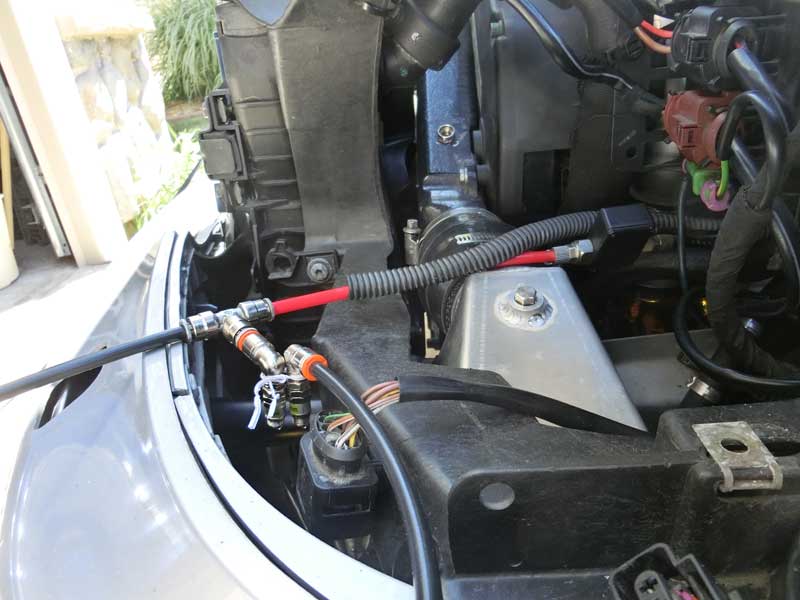
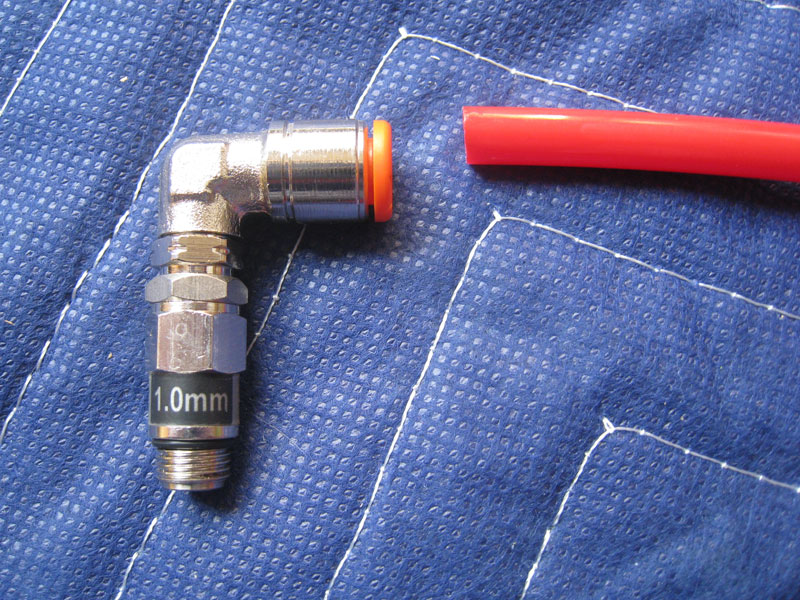
The stock MAP sensor was used to record Intake Manifold pressure and a 4 BAR sensor was connected to a fitting that reads exhaust pipe pressure at the secondary O2 sensor bung, which on my car is located in the downpipe prior to the catalytic converter. The setup for reading the exhaust pressure is similar to what is shown above, though the picture was from a prior configuration, that I have since economized a bit so as not to be hanging down like the picture shows.

The cover consisted of a piece of heavy duty aluminum foil doubled over and then a piece of DEI exhaust wrap placed on top of the foil to create the seal with some reinforcement.
I took readings under three conditions; first with the exhaust pipe open as it would normally be, second with the cover obstructing approximately half of the exhaust pipe exit, and last with the exhaust approximately 80% blocked off.
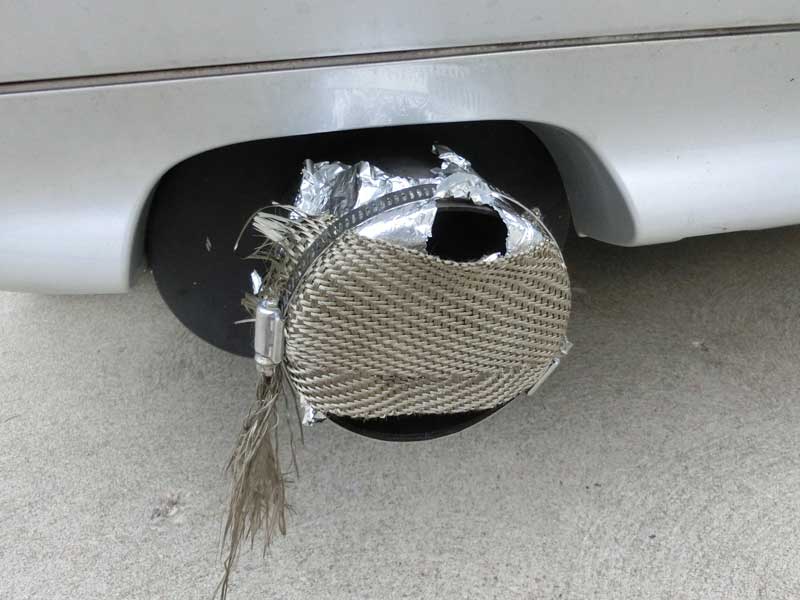
As the above ‘after’ photos show, the coverage of the DEI wrap was not complete, and there was sufficient pressure build up in the exhaust to rupture the foil cover where it was not reinforced.
The occurrence of the ‘blow-out’ is clearly indicated in the exhaust back pressure chart (below) that compares the fully open to 80% covered conditions. The rising pressure suddenly drops quickly, then continues rising as engine speed increases.
Starting engine speed was 2000 rpm for three sets of measurements and then approximately 2200 rpm was recorded two times. The intent being to see how boost onset was affected when starting at a higher airflow rate.
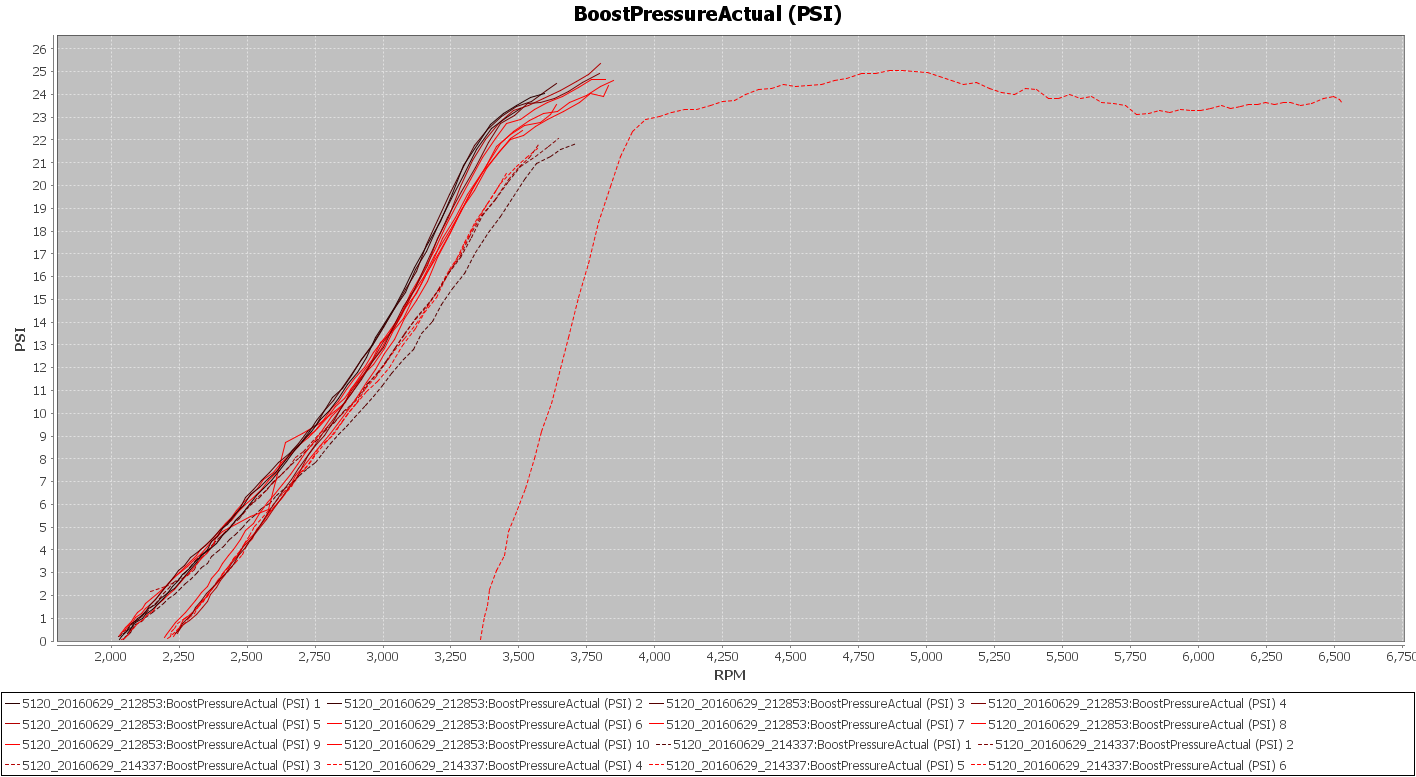
Shown above is the boost onset for the six different cases. The solid dark lines are the first series where the exhaust was open. The solid red lines are with the exhaust half covered, and the dashed lines are with the exhaust exit 80% covered. The trend is for the boost onset to slow as the exhaust exit becomes increasingly covered.

Shown above is the first data series for the two extreme cases, with the exhaust unobstructed represented with the orange line, and the exhaust 80% obstructed represented by the blue line. The hole forming in the foil takes places around 2750 rpm of the first pull.

Above is the the same exhaust back-pressure data with the addition of the second and third 2000 rpm starting engine speed pulls.
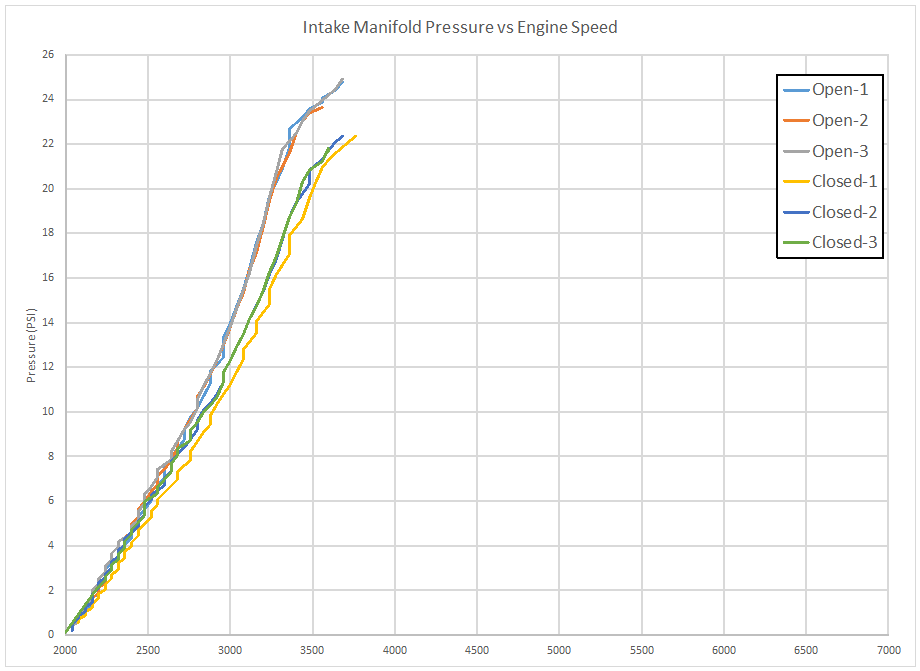
Finally, shown above is the Intake Manifold Pressure for the two extreme test cases.
Conclusions:
It is apparent that blocking off the exhaust will increase the back pressure in the exhaust system, and the increasing back-pressure causes boost onset to be slowed.
What is unclear is how representative the worst case test may be of alternative exhaust systems. Without putting different exhaust systems on the car to record the back-pressure that they generate I cannot speculate as to how much back-pressure exists in other systems.