The recent posts about JAEInnovation’s builds have introduced a dynamometer that I previously had not heard of, a Dynocom. As those posts pointed out, I did not have data available to crosscheck the accuracy of this dyno, so statements about vehicle wheel horsepower are of low confidence.
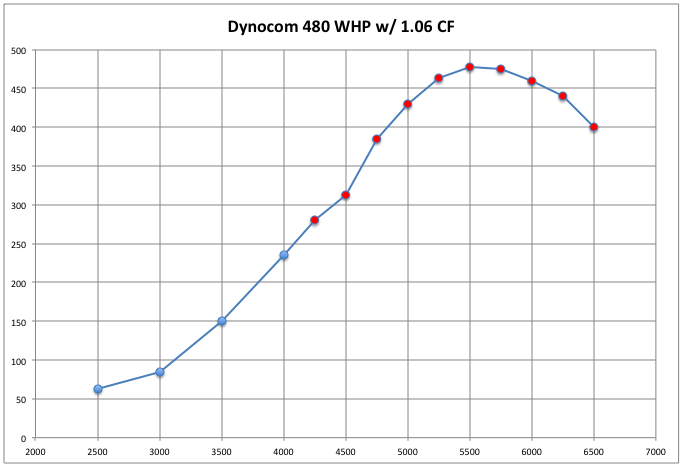
I was in touch with a person who had their S4 measured on this dyno (operated by Doman8 Performance), and they informed me that data logging was showing a FATS of 3.2 seconds and the dyno chart produced by the Dynocom measured a peak of 480 whp. The wheel horsepower curve is reproduced below:
Dynocom 480 whp pull
To try and estimate what the accuracy of the dyno is I began correlating the wheel horsepower curve with the FATS time. The first step was to pull samples of the wheel HP data over the FATS pull range, taking samples at every 250 rpm beginning at 4250 rpm and continuing to 6500 rpm. These points are shown in the chart above highlighted in red.
The average whp of these ten points is 412. The median value is 435. I decided to use the median because the peaky curve allows the low figures at the start to pull the average down substantially.
The dyno chart showed that a 6% correction had been applied for atmospheric conditions. As has been previously mentioned, this correction should not be applied to a boosted engine. After backing out the atmospheric correction factor the result is 410 wheel HP.
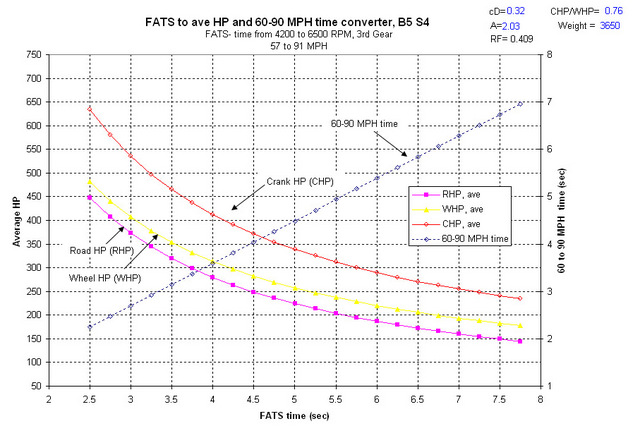
Now I look at how the FATS average wheel HP calculator compares with this value.
Chart produced by rktskicar
A FATS time of 3.2 seconds should be the product of an average wheel HP over the FATS range of approximately 380 whp. The result I estimated from the dyno chart was 410 whp.
If the Dynocom has a similar difference to road values as the Dynojet, which I have found to differ by approximately 6%, the Dynocom average wheel horsepower is more likely 387.
The FATS estimate of 380 whp compares well with the adjusted Dynocom estimate of 387 whp.
If the peak wheel horsepower reading of 480 is adjusted in accordance with this process the result is a peak of 427 wheel horsepower.
Conclusion:
A single data point is not something to rush out and use to define the accuracy of the dyno. On the other hand, it’s better than nothing, and the results obtained point to agreement between the two methods of arriving at the average wheel horsepower.
Two days after I talked about JAEInnovations efforts to crack the 500 whp mark with XS Power side mount IC’s they followed up with me about accomplishing the goal of reaching 500 whp.
They had removed the ProjectB5 RS6-X hybrids from the S4 and installed the larger Silly Rabbit Motorsport RS6/K24 turbo. The information I have on each product is that the RS6-X uses a 42.6/56 compressor wheel versus SRM’s 45.8/62 compressor wheel.
With the SRM product at work their Dynocom reported a peak wheel horsepower of just under 520, handily surpassing 500 whp. In this case there was no atmospheric condition correction, giving more confidence that the number may be closer to truth.
Unanswered still is the question of how accurate the Dynocom is. With no other means provided to assess the engine power output the accuracy of this dyno is uncertain. As I mentioned in the earlier discussion the reports I have found about the Dynocom suggest that it reads on par with a DynoJet, something I have found to read about 6% above street logs I have recorded.
Assuming the Dynocom is similar, this would put the latest peak wheel horsepower number around 490, not quite 500, but close enough to consider the goal achieved. In this case the brute force method of power production has succeeded, stick a big enough turbocharger on the engine and 500 whp can be reached.
This effort generated a couple of interesting bits of information. JAE stated that with the RS6-X turbocharger they could not generate more than 27 psi of boost, note that this differs from the 30 psi I thought they operated the turbochargers at. The fact that they had tightened the wastegates as much as they could and still were only generating 27 psi of boost pressure seems to show just how much pressure drop the XS Power IC cores cause.
Estimates of the pressure drop on the flowbench for the IPP IC’s, the next poorest flowing IC’s I measured, are in the region of 4 psi for the airflow at a combined mass flow rate for both IC’s of just under 400 g/s. I’m estimating 400 g/s is about what these RS6-X’s at 27 psi would be flowing.
IPP IC Pressure Drop Curve
The IPP IC is being used because I sampled the pressure drop at several flow rates with that core but did not perform the same measurement with the XS Power IC. Having multiple samples allows me to create a trend curve and then extrapolate out to higher flow rates. The XS Power IC I was loaned was only measured at 28″ of H2O which is the standard test depression I use for comparing IC flow rates..
Because the XS Power IC flows less than the IPP it is proper to conclude that pressure drop at any mass airflow rate will be less for the XS Power than the IPP. In addition, because flow bench testing is performed at atmospheric pressure, and the RS6-X turbo’s were compressing the charge air to 27 psi, the increased density of airflow on the car will lead to greater pressure drop through the core.
All of which is to say, assuming a 4 psi drop through the XS Power core is probably a conservative estimate. Coupled with the knowledge that the RS6-X topped out at 27 psi of boost pressure, which is recorded at the intake manifold, the turbocharger was in all likelihood generating 31 or more psi at the compressor housing outlet, which could explain why JAE couldn’t get any more boost from the turbocharger.
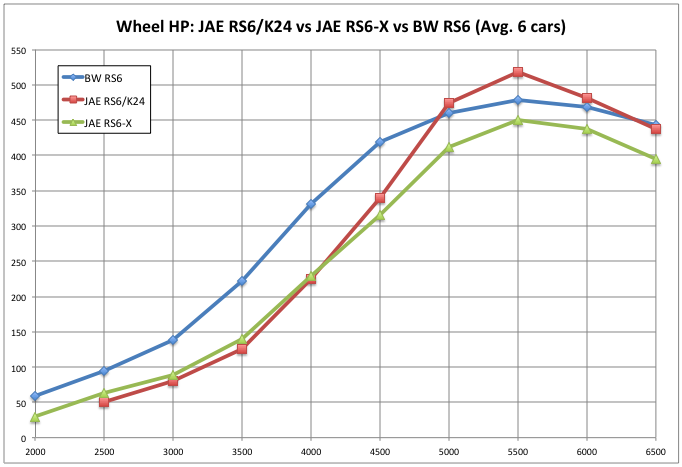
In the end, what matters is how the car performs, so I pulled up my RS6 turbo average data, results collected on six different BW RS6 equipped S4’s, and compared those averaged results to the JAE RS6-X and RS6/K24 build performance. I have not adjusted the JAE Dynocom numbers, these are the uncorrected values pulled off their dyno charts.
JAE RS6-hybrid builds vs BW RS6 based builds
It is not very surprising to find the RS6-X and RS6/K24 hybrids don’t generate power as quickly as the BorgWarner RS6 equipped cars. BW RS6’s have a reputation for spooling up relatively quickly.
The RS6-X underperforming the RS6 everywhere is a little surprising, except that knowing the RS6-X car was equipped with XS Power SMIC’s, and the BW equipped cars were not, tilts the advantage to the RS6 cars.
Something else that is a bit of a surprise is how briefly the RS6/K24 car outperforms the BW RS6 equipped average. Without having much insight into the JAE car engine data I again attribute the poor performance to the XS Power intercoolers.
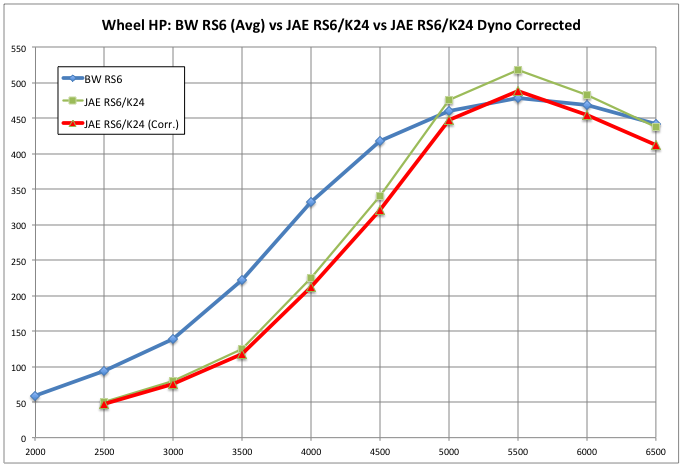
Because there is a strong likelihood that the Dynocom results overstate the real wheel horsepower figures in a way similar to a Dynojet, I applied a 6% correction to the JAE Dynocom results for the 500 whp pull to assess how these three curves may match up.
JAE RS6-hybrid build Corrected Dyno data vs BW RS6
With wheel horsepower peaking around 490, the JAE RS6/K24 build peaks out around the average of the six BW RS6 turbo builds.
Conclusion:
JAEInnovations has successfully shown that a peak wheel horsepower of 500 can be reached on a B5 S4 using a set of inexpensive XS Power side mount IC’s as measured by a Dynocom dynamometer.
Area under the curve appears to have taken a big hit by following this approach of utilizing poor performing IC’s with WMI, as compared to using smaller turbochargers and better intercoolers.
With little more to go on than a dyno chart from a device with unknown accuracy the above evaluation is hopefully just a preliminary assessment, vehicle data-logs along with a second method of engine power measurement would go a long way to establishing credibility of the Dynocom results.